Table of Contents
A cement plant generates millions of data points every day, including kiln shell temperatures, mill bearing vibrations, baghouse pressure differentials, finish grinding particle distributions, and preheater gas composition. Most of it sits in isolated DCS historians or SCADA logs, visible to one operator on one screen, invisible to the plant manager watching a spreadsheet.
IoT in cement plants changes what happens to that data. Sensors across the production line feed a cloud platform that surfaces patterns operators, maintenance teams, and executives can act on in real time. The shift matters because cement manufacturing has two persistent problems conventional monitoring can’t solve fast enough: Quality variance across batches and unplanned kiln downtime.
The quality gap: one hour between clinker and lab result
Cement quality depends on variables that interact across the entire process: raw mix chemistry, burning zone temperature, clinker mineralogy, and grinding parameters. Two critical indicators are free lime content and Blaine fineness.
Free lime, uncombined calcium oxide after clinker formation, needs to stay between 1% and 2%. Too high wastes raw materials and fuel; too low creates quality problems leading to rework or complaints. One plant using real-time free lime modeling (correlating free lime to NOx as a soft sensor) saved $600,000 per year: $300,000 in fuel and $300,000 in avoided quality losses (Seeq, 2024).
Blaine fineness cement’s specific surface area in cm²/g controls setting time and strength development. During that hour, the finish mill may produce hundreds of tons outside spec.
IoT sensor networks close this gap. Online particle size analyzers, continuous XRF monitors, and NOx-correlated soft sensors feed real-time Blaine and free lime estimates to dashboards, replacing the one-hour delay with continuous visibility into burnability index and product conformance.
The downtime gap: $300,000 per day that didn’t need to happen
A rotary kiln at a 1 MTPA plant generates roughly $300,000 in revenue per day. Every unplanned shutdown day is that amount lost plus emergency repairs running 18–25% higher than planned maintenance (UptimeAI; LLumin, 2025). Kilns run at 1,500°C. Vertical roller mills grind under severe mechanical stress. ID fans and gearboxes accumulate wear that time-based schedules can’t track precisely.
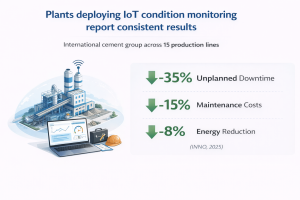
Plants deploying IoT condition monitoring report consistent results. An international cement group across 15 production lines achieved 35% reduction in unplanned downtime, 15% lower maintenance costs, and 8% energy reduction (INNO, 2025). A Vietnam plant cut unplanned downtime 34% after consolidating 2.3 million daily sensor readings into unified dashboards (Oxmaint, 2026).
Where the industry is heading: IIoT with AI at the edge
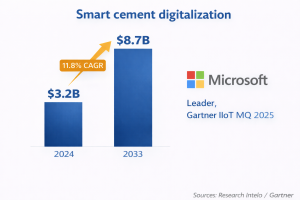
Microsoft was named a Leader in the 2025 Gartner Magic Quadrant for Global Industrial IoT Platforms, reflecting Azure’s maturity for exactly this use case. Gartner projects that 95% of new industrial IoT deployments will include AI-edge inference, enabling anomaly detection at process-control speed.
The smart cement digitalization market reached $3.2 billion in 2024 and is projected to reach $8.7 billion by 2033, growing at 11.8% CAGR. That growth reflects plants moving from stage one, connecting sensors to stage two: predicting failures and optimizing quality in real time.
The technology stack: Azure IoT Hub + Databricks + Power BI
Azure IoT Hub ingests telemetry from existing DCS and SCADA via OPC UA and Modbus TCP without replacing control systems. It handles millions of readings per day at sub-second intervals.
Databricks on Azure provides the lakehouse where sensor data, quality lab records, and maintenance logs converge. Predictive models train here, correlating vibration signatures to bearing degradation, or kiln shell temperatures to refractory wear, using the plant’s own history.
Power BI surfaces what matters to each role. Plant engineers see real-time Blaine trends and free lime soft-sensor readings. Maintenance managers see health scores and predicted failure windows. CXOs see OEE, energy cost per ton, and quality compliance continuously, not monthly.
How Advaiya connects plant floor data to CXO decisions
Advaiya’s BI and dashboards practice builds the intelligence layer between raw sensor data and business decisions. When Advaiya built a unified data platform for a conglomerate spanning manufacturing and infrastructure, the results reflected what cement plants need: 20% energy efficiency improvement, 10,000+ tons of carbon emissions reduced, and 300+ automated validation workflows replacing manual reconciliation.
The approach starts with what the plant already has existing DCS, SCADA, and historians, and connects it to Azure and Databricks without control system replacement. Power BI dashboards are configured for each role, so data that took an hour to reach the lab now reaches the decision-maker in seconds.
Connect with Advaiya about cement plant intelligence →