Earned value management answers three questions simultaneously: how much work was supposed to be done by now, how much was actually completed, and what did it cost? In construction, those three data points, planned value, earned value, and actual cost, produce the metrics that determine whether a project finishes on budget or spirals past it.
The cost performance index (CPI) tells you how efficiently money is being spent. The schedule performance index (SPI) tells you whether physical progress matches the timeline. The estimate at completion (EAC) projects that the final cost will be incurred if current trends continue. And baseline variance tracks drift from the original approved budget.
These are the differences between catching a 5% overrun at month three when corrective action is affordable and discovering a 20% overrun at month twelve. The problem: most Indian construction firms don’t have these numbers in real time. They have them in retrospective reports, compiled manually, weeks after the data was relevant.
The cost of delayed visibility in Construction
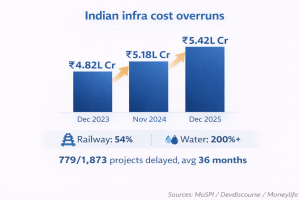
As of December 2025, 1,392 Indian infrastructure projects reported cumulative cost overruns of ₹5.42 lakh crore, above the original estimates of ₹29.68 lakh crore, ballooning to ₹35.10 lakh crore (MoSPI / Devdiscourse, January 2026). Railway projects overran by 54%. Water resources have increased by over 200%. Of 1,873 monitored projects, 779 were delayed an average of 36 months.
An IIT Madras study found that 68% of cost overrun originates in the detailed design stage, long before the first pour. Top drivers: scope creep, construction delays, rework, and awarding contracts to the lowest bidder. McKinsey’s analysis of 500+ capital projects globally found the average large project runs approximately 70% over budget (McKinsey, 2022). Predictive CPI monitoring can detect cost risks up to six weeks in advance and reduce overruns by up to 35% (TrueProject, 2025).
Why does the overrun happen before anyone sees it?
Cost overrun doesn’t arrive suddenly at completion. It accumulates through design and early execution in forms that spreadsheet-based tracking can’t detect fast enough. A project manager in one city works from a budget that doesn’t reflect procurement updates made in another. Change orders modify scope without triggering baseline revisions. Material price escalation compounds weekly but gets reconciled quarterly.
By the time someone calculates CPI manually, the index has already dropped below 0.95. And in construction, once CPI falls below 0.95 in the first 20% of a project, the probability of recovering to 1.0 by completion drops sharply, a pattern documented across decades of earned value research (PMI). What’s missing isn’t the methodology. It’s the data infrastructure that makes EVM continuous rather than periodic.
Where the industry is heading: predictive cost analytics
The shift is from retrospective EVM, calculating CPI and SPI after the reporting period closes, to predictive EVM, where ML models analyze performance trends and forecast EAC before the next cost milestone. AI-powered systems detect subtle CPI degradation signaling procurement bottlenecks or SPI decay correlating with resource conflicts across concurrent work packages.
They don’t replace the project controls team; they give it a six-week head start on problems that used to surface as surprises.
The technology stack: Microsoft Fabric + Power BI + OnePlan
Microsoft Fabric provides the data foundation. Cost data from ERP, procurement, timesheets, subcontractor invoices, and site progress flows into a unified lakehouse, eliminating the reconciliation gap where overruns hide.
OnePlan provides the project and portfolio management layer on the Microsoft platform. It connects work breakdown structures to financial baselines, making earned value calculation native to the workflow. CPI, SPI, and EAC update as actuals flow in, not when someone refreshes a spreadsheet.
Power BI surfaces the intelligence. Site PMs see work package CPI with variance alerts. PMO leads see portfolio SPI trends. CFOs see EAC projections and baseline variance updated continuously, not quarterly.
How Advaiya builds construction cost intelligence
Advaiya’s project portfolio management practice brings the discipline of earned value into organizations that have historically tracked costs through disconnected systems. When Advaiya implemented a centralized permissions and data management system for an infrastructure company, the results reflected what construction portfolio analytics require: 90%+ reduction in manual work, 95% data quality index, and 90% reduction in project setup time.
The approach starts with mapping existing data sources, ERP, procurement, and site reporting, and connecting them through Fabric into a single cost truth. EVM baselines are established in OnePlan. Power BI dashboards are configured so CPI drift triggers an alert to the project controls team, not a quarterly surprise to the CFO.
Connect with Advaiya about construction cost analytics →