Are you unable to make data-driven decisions?

Regardless the industry and the size of your company, when it comes to making strategic decisions, we often rely on gut feeling, ad-hoc reports or other traditional approaches. A recent study found that 58% of respondents said their companies base at least half of their regular business decisions on gut feel or experiences, rather than on data and information. And, some of the most crucial reasons for not using data for decision making are the lack of data availability and data of poor quality. With the increasing emphasis on data-driven decisions, we can no longer depend on emotions and intuitions. Because, a good decision always need insights from the past, present, and the future. To gain better visibility and control over the data, you need a data-driven culture across the organization. So that everyone can recognize hidden patterns, can find the solution to their unanswered business problems and can make smarter business decisions. For instance, in project portfolio management – from executives to project managers to team members – everyone needs insights at various levels. A team member wants to know the list of tasks, the priorities, and the timeline for these tasks, etc. A project manager wants to know which project is performing well, who is available to work for the project and so on. Executives need to know the overall company portfolio to check the overall business progress and plan investments. They all need data that they can trust to facilitate decisions making and take actions. Advaiya AdValue offers a set of pre-built templates and click-to-deploy BI dashboards available for different roles in the organization to access all relevant project information quickly and make informed decisions on-the-fly. If we talk about marketing, the digital world has changed the way marketing happens. Unlike in the past, marketers today need varied insights before planning their strategies. They want to know the performance of the campaigns executed in the past, platforms that worked well for them, tactics that have given good results and other crucial numbers. Getting an in-depth and unified view of all the relevant information is easier said than done. Because, data is coming from a variety of sources, both internally i.e. within the organization, or externally from social media and other channels. Data-driven marketing help marketers reach the right people with the right message at the right time and make marketing relevant. A study by Forbes states that two-thirds of engaged data-driven marketers are seeing new customers because of data-driven initiatives. Advaiya Adaptive BI services help you monitor and analyze the business health data the way you want so you can take actions right away. From improving the customer experience to increasing efficiency and reducing costs, organizations of all sizes are using business intelligence and data analytics to make smarter and data-driven business decisions to plan better for the future. Do you want to transform data into insight and action? Contact us at connect@advaiya.com or give us call +1-425-256-3123 and let’s get started!
Facing unplanned downtime and reduced productivity?

Despite developments in infrastructure robustness, organizations still face software, hardware, network, and database downtime, ranging from short periods to closing the business for days. Unplanned downtime has been impacting companies in multiple ways: Reduce profitability – this is the most direct effect Harm business reputation and loyalty Compliance impacts – if you have SLA’s or performance guarantees, 100% response times to your customers Potential remedial costs – overtime costs to recover the work lost All these negatively affect your organization’s performance and productivity. 100% uptime is crucial for organizations today, which depends on IT both for employee productivity and a competitive differentiation to stay ahead. So how can you prevent unplanned downtime and hampered productivity? Choosing an infrastructure solution that best suits your business needs The right cloud strategy promises a lot: Minimal recovery time – With cloud-based disaster recovery, the backup environment will be ready to serve your mission critical applications the moment any incident is detected at the primary sites. Once end-users have been transferred to the cloud environment, organizations can get to work repairing the primary site rapidly to cut the amount of time spent utilizing the recovery site. Compliance and security solutions – Cloud vendors stay up to date with the state-of-the-art industry standards and compliance certifications. Single-tenant cloud users enjoy an additional layer of security as there’s no chance of their data being compromised, accessed by unauthorized users or mixed with another company’s data. Elastic infrastructure – Cloud-based services are ideal for businesses with growing or fluctuating demands. The cloud provides the agility to easily scale up as demands grow, and scale down again as per the need. So, the customers can add more users, storage, and features over time. The benefit of this flexibility is that companies only have to pay for what they need and use. Reduced CAPEX – Cloud computing helps bring down the high cost of infrastructure. The pay-as-you-go option allows for a subscription-based model, where you only pay for services procured rather than overbuying resources. Not on the cloud yet? If you are looking to protect your IT environment and shorten the backup and recovery time, we can help you move to the cloud. As Value Added Reseller (VAR) of major cloud services providers, Advaiya brings together consulting, migration, operations and licensing services enabling you to adopt cloud technologies in the most fruitful manner seamlessly.
10 reasons to move your infrastructure to Microsoft Azure

Microsoft Azure is the core of Microsoft’s Cloud offering, and it’s getting more and better received each year. In the final quarter of 2016 alone, Microsoft has reported a whopping 102% growth in Azure revenue, with usage doubling year after year. As we look towards 2017, we’ve picked our top 10 reasons organizations are moving to the cloud. 1. Agile and scalable Business growth is often unpredictable. For your IT platforms to provide the most value, they need to be able to grow and scale as your business does. Azure shines at this, allowing you to develop applications as a cluster that designates a web application to a set of specific set of processes. With applications spread across multiple of servers, they won’t run out of server capacity. 2. Microsoft compatibility For any organization currently using Microsoft products like SharePoint and Office 365, a cloud infrastructure provider that works seamlessly with existing technology is vital. Microsoft Azure is in a unique position to offer that ease of use to organizations, over providers like AWS. The same Virtual Machines can also be used on-premises, further simplifying processes. 3. On-demand computing Vast amounts of computing resources can be provisioned in minutes, typically with just a few mouse clicks, giving businesses a lot of flexibility and taking the pressure off capacity planning. 4. Elastic hosting With the complex range of computing and software options available on the market, flexibility is vital. Azure offers Infrastructure as a service option, allowing organizations to outsource their cloud infrastructure (to us for instance) and follow a pay-as-you-go, model. 5. Secure and resilient Microsoft is one of the most renowned, long-standing technology companies out there and has proved their capability in the enterprise space many times over. For many organizations where security and reliability are critical, this is a big selling feature of Azure. Data is also safe, with Azure based on the Microsoft Security Development Lifecycle, a highly advanced approach to developing the most secure code. 6. Global data centers For global organizations with employees located in several countries, local data centers to improve speed and uptime are important selling points of a cloud infrastructure provider. Azure is backed up by Microsoft’s growing number of global managed data centers; there are currently 30 with eight additional regions including Korea, France, and four more locations in the USA coming soon. From a user’s point of view, their experience is also hugely improved by having a local data center. 7. Hybrid capability Azure also gives users the choice to build hybrid environments, allowing organizations to leverage on-premises resources and the advantages of the cloud without complexity. 8. Economies of scale Azure’s pay-as-you-grow model decreases unnecessary costs as you’re only paying for what you use. With their large customer base, they have also been able to pass on volume discounts to their clients. 9. Simplified management Even though the Azure platform has been around for many years now, the services that it offers have been continuously evolving, offering new features to consumers. It has not been standing still from a management point of view either, and the IT professional now has a much more superior API to use in the form of Azure Resource Manager (ARM). 10. Support From small dev-test projects to global product launches, Azure is engineered to handle any workload. Azure also offers enterprise-grade SLAs on services, 24/7 tech support, and service health monitoring. Microsoft also provides support in a variety of languages to help the regions of their data centers. We work with clients every day to build business cases for Azure, consulting on the best strategies for cloud infrastructure that will add value. Look here for more info on the cloud infrastructure services we offer and feel free to contact us to discuss your requirements. Want information about our Cloud infrastructure services? Click here
Is your organization truly data-driven?

You are a bank manager. You discover the customer churn rate of your bank which has steadily increased. You realise a loophole in retaining the existing customers of your bank. To validate your instincts, you gather the past six month’s data of customers and hire an analyst to come up with the results quickly. But here is the problem. Analyst working on the project realises that the data has a lot of noise, is not captured at a granular level, is coming from multiple sources, not a single version of the truth and is also limited. Hence insights can’t be drawn at the required time. This results in loss of business. Does this scenario sound familiar to you? The reason behind this grief is the bank is not a data-driven organization. Is your organization data driven? Do you embrace data? Can you provide decision makers of your company with the data they need? Does your organization make business decisions with the help of high quality, noise free, granular data? Are all the data sources integrated at one place providing a single version of the truth? If your answer is yes, then congratulations!! You are indeed a data-driven organization. But if the answer is no, you should infuse analytics in your company. In today’s digital age, we are engulfed with an enormous amount of data. It is an acceptable fact that organizations who have the knowledge to extract insights and decisions based on data would be at a competitive edge rather than the organizations who still have not understood its value. We’re in a digital transformation age where data is more valuable than ever. Companies would only be able to have a competitive edge if they truly understand the power of data and promote the use of data in decision-making. Switching to a data-driven organization usually takes time, but hard work pays off. Constructing this sudden shift is a tedious process but this journey from capturing data to making it trustworthy ensures everybody in the company is on the same page with the most updated information at their fingertips. So how do you turn to a data-driven organization? Below are few points to get started: Information Management: Start capturing the data from the most granular level. Each single field should be detail-oriented. This ensures that every single detail of all the business processes in an organization is identified and stored in databases. Data Integration: Often data does not reside on a single data source. We rely on data warehouses to integrate our disparate data sources. Traditional data warehousing can take up to 6 months to 1 year and significant effort to complete. Surely this is not the right way to stay competitive in today’s ever-changing and ever-evolving data landscape. Is there any solution to optimize the data warehouse lifecycle? This is where automation comes to rescue. We now have self-service data warehouse tools with drag and drop capabilities just like modern BI tools. TimeXtender is a leading data warehouse automation tool which automates the entire cycle of implementing and maintaining a DWH/BI solution. Other notable vendors in this space are Wherescape and Attunity. Next Gen BI Tools: Are you still using traditional BI tools for data integration and reporting? If yes, then you have already lost half the battle. Businesses today can’t wait for weeks or months for the BI reports. And this is where self-service BI tools like Tableau, Power BI, Qlik provide an edge over the traditional IT-centric reporting tools. You can have dashboards/reports in just a few clicks without any involvement of IT. Teamwork and Collaboration: This should be one of the key focus areas to become a data-driven organization truly. Self-service BI tools provide a platform that allows analyst, data scientists, decision makers to work collaboratively and act sensibly on approaches for deriving insights of a company. With the help of collaboration, all the members working on a data intensive project are now able to collaboratively work with real-time access to all the features of a BI tool. Training & Reskilling: Employees should have basic knowledge of reporting skills. Also, the power users of analytics must be reskilled and trained with the latest development in analytics space. This ensures that your organization is well equipped to support value-driven decision making. Welcoming a data-driven approach is vital to your organization. It helps you in making decisions that are informed, intelligent and impactful. To understand more about making powerful decisions that lead to desired results, Register for webinar recording on Make powerful decisions with Power BI
Enable Your Data with Adaptive BI for Excellence

Right use of enormous data available internally and externally to organizations can generate immense dividends. Deriving meaningful insights from that data—and converting knowledge into action—is easier said than done.
Organizations have been utilizing Business Intelligence (BI) and analytics to analyze and visualize complex data sets, but the biggest challenge is finding the set of right solutions that enable organizations to generate value through the process efficiently. As the data management challenges grow, the use of BI within the organization has extended and triggered the need for self-service BI – to enable everyone to gain visibility into business operations and to make data-driven decisions efficiently, today and for the years to come.
So, what’s next? Companies need a right mix of people, processes, and technology to enable and govern their data and unleash the real value of it.
Advaiya’s Adaptive BI services fulfil an organization’s need for data aggregation & visualization across its functions. With our extensive knowledge and expertise, association with state-of-the-art technologies like Microsoft and TimeXtender, we deliver a BI solution that meets business analytics needs at all stages of the BI lifecycle. We deliver intelligent insights with user-centric information design to help you become more mature and capable data-driven organization.
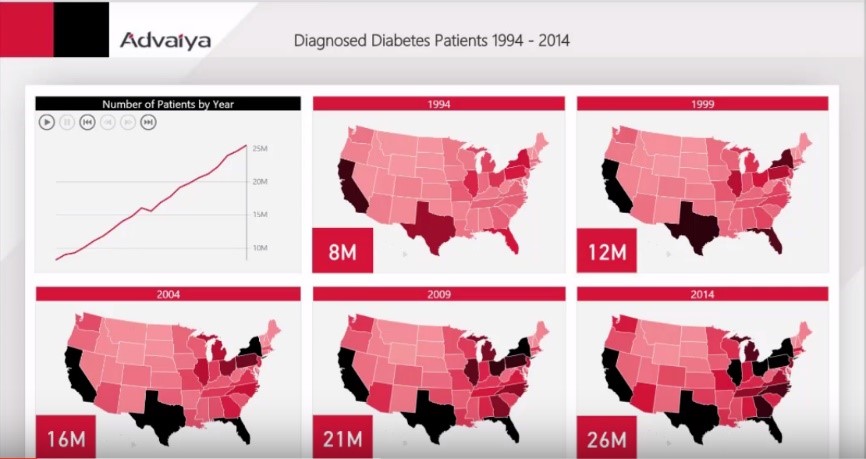
We use an intelligent and structured approach to bring your data to next-level and help get all the valuable data and comprehensive insights at your fingertips. We make advanced technologies, like Power BI and automation to enable data discovery, availability and comprehension, so you can use your data effectively, today and in future. Just an example, how an appropriate information design with comprehensive data from multiple sources provided significantly useful insights for disease control and prevention via rich visualization.
Get easy access to data from multiple sources, gain insights via interactive dashboards & reports, be informed and make better decisions.
Get started today with D.I.A.D (Dashboard-in-a-day), our Data Enablement services to help you understand your data better through meaningful visualization.
Handling Managed Metadata Using SharePoint List Workflow
Recently we did a couple of Project Server/Online Implementation based projects which included customizations like Demand Management Workflow, Document Approval workflow, Issue or Risk Escalation workflow and much more. This required Project workspace customization to enable standard processes for every project within client EPM tenant setup. During these customizations, one challenge was to apply an item approval workflow for a custom list of the workspace, and when the list item is approved, the list item should be copied/moved to another list which has all approved list items only.
We thought this should be an easy solution using SharePoint designer workflow and should not take much time to implement 🙂 but twist came when we found that a list item can be copied easily by using Create new list item/Update List item workflow activity but any managed metadata column does not follow this.
Below is the detailed error and solution, how we customized the managed metadata updates on a SharePoint list using SharePoint Designer.
Scenario:
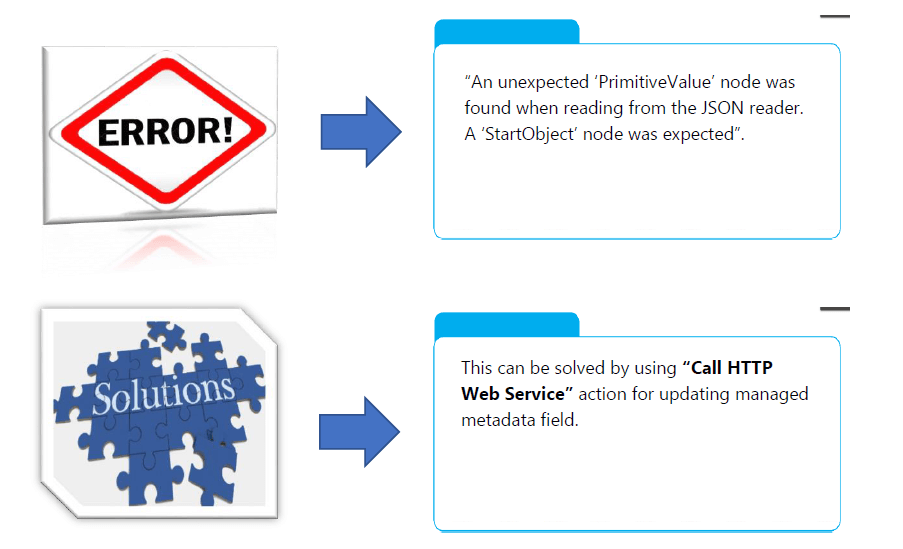
In SharePoint Designer you can use the “Update List Item” action to update a field in list or document library. But, whenever you update a managed metadata field through the “Update List Item” action, or you create an item from one to another list containing managed metadata field through the “Create item” action, a BadRequest error occurs:
Follow below-given steps for the solution to your problem:
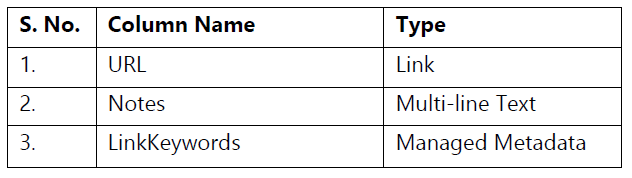
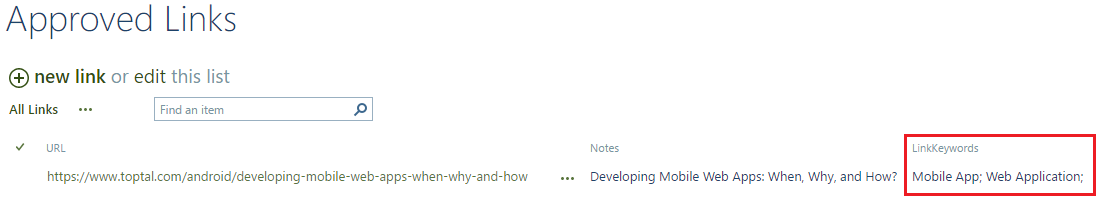
Let’s, create two SharePoint lists, Pending Links & Approved Links. New link item is added to Pending Links; then it is routed to Link Managers for approval. If link item is approved then it is copied to Approved Links, else remains in Pending Links. Add managed metadata field, for, e.g., LinkKeywords, to both lists.
Both Pending Links and Approved links contains these 3 fields :
Note: Managed metadata field name should not contain a blank space. Otherwise managed metadata field value would not be updated using workflow.
SharePoint will automatically add another field called “LinkKeywords _0”.
Steps
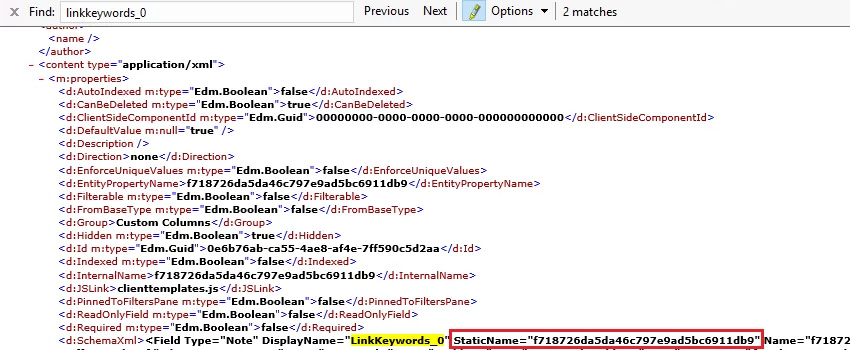
1. Get the internal name of LinkKeywords_0:
Go to https://xyz.sharepoint.com/site/_api/web/lists/getbytitle(‘listtitle’)/fields
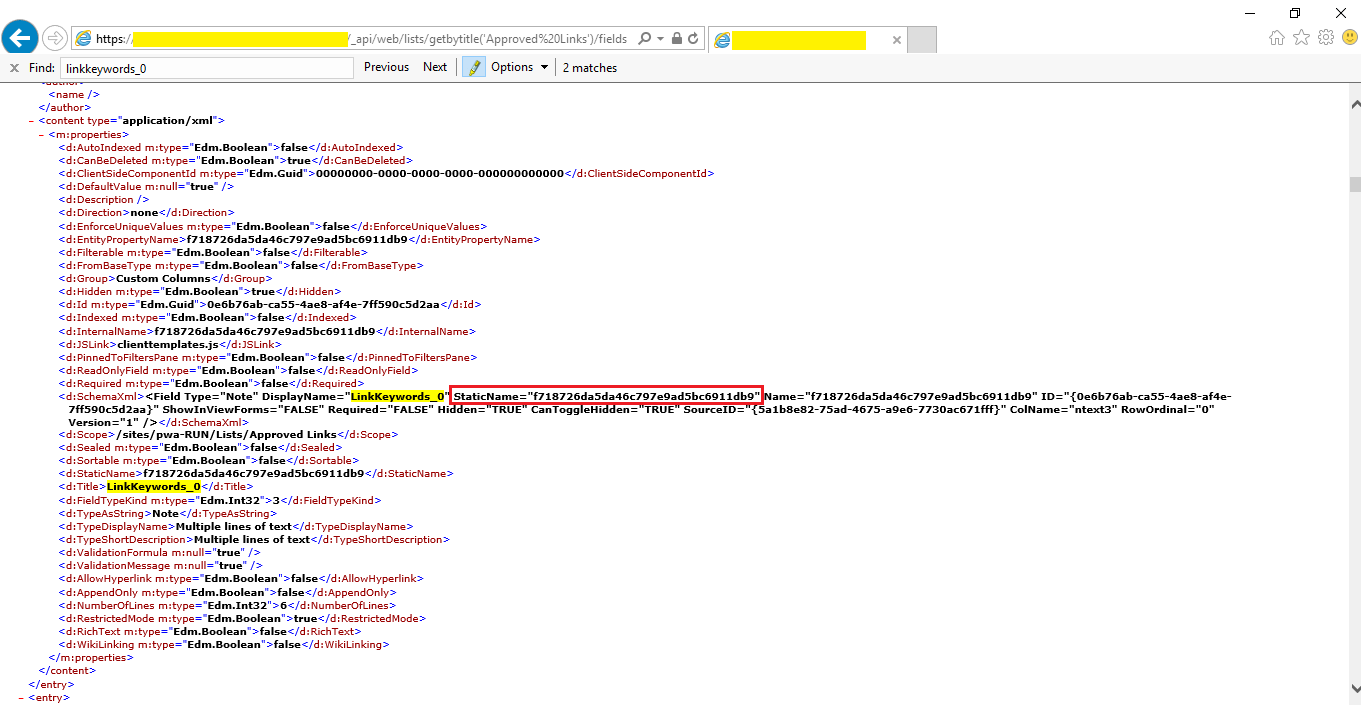
Static name for LinkKeywords_0 hidden field is “f718726da5da46c797e9ad5bc6911db9”.
2. Get the list item type entity type full name:
Go to https://xyz.sharepoint.com/site/_api/web/lists/getbytitle(‘listtitle’)
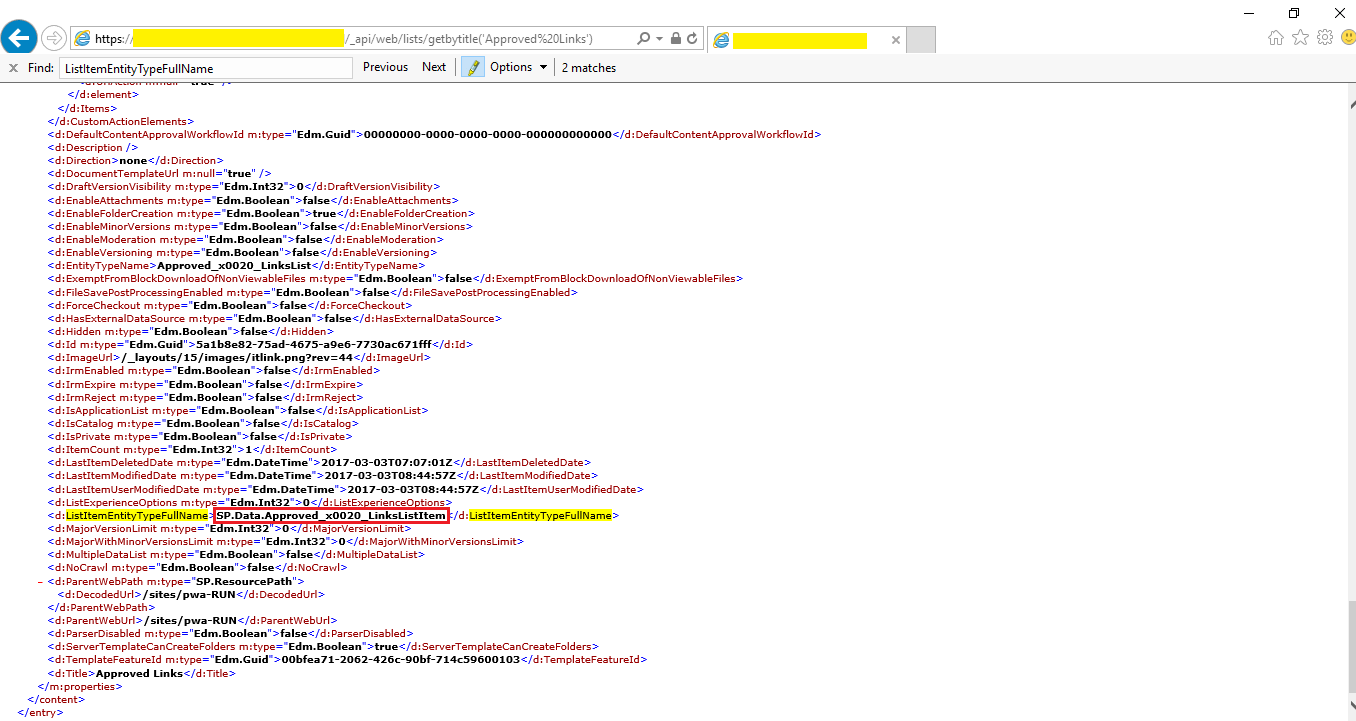
ListItemEntityTypeFullName of Approved Links is “SP.Data.
Standard format for ListItemEntityTypeFullName is “SP.Data.<<ListTitle>>ListItem”. Space in list title will be replaced by “_x0020_”.
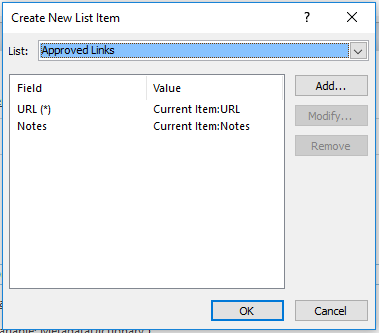
3. Add workflow action to create item:
Use workflow action “Create list item”.
Item will be created from Pending Links to Approved Links, whenever task outcome is approved. Add fields other than managed metadata field. The outcome of this process will be taken into NewItem variable of GUID type.
Here, do not add managed metadata type field otherwise you will get error “An unexpected ‘PrimitiveValue’ node was found when reading from the JSON reader. A ‘StartObject’ node was expected”.
Now, workflow has been configured to create item in Approved links, but managed metadata field has not been updated on list item. To do this you need to use workflow action “Call HTTP Web Service” followed by building required dictionaries.
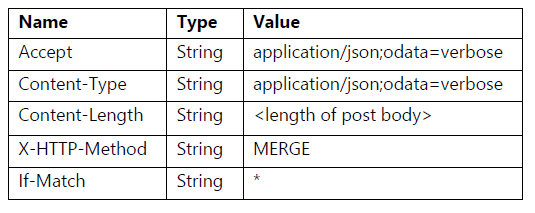
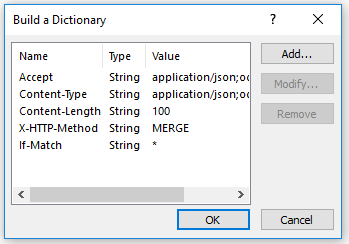
4. Build Headers dictionary to store following headers:
Use workflow action “Build Dictionary”.
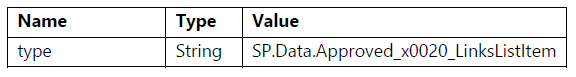
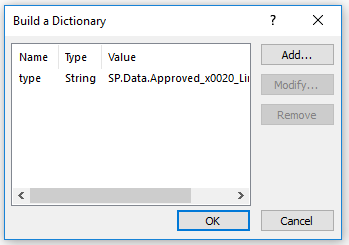
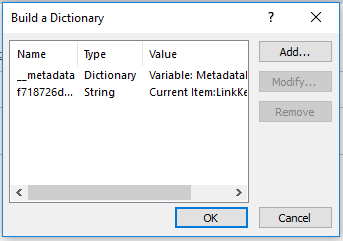
5. Build metadata dictionary for List item type:
Use workflow action “Build Dictionary”.
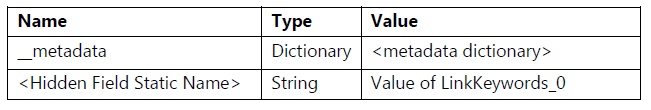
6. Build the data dictionary:
Use workflow action “Build Dictionary”.
7. Call HTTP Web Service:
Use workflow action “Call HTTP Web Service”.
Add Service URL of item to be updated:
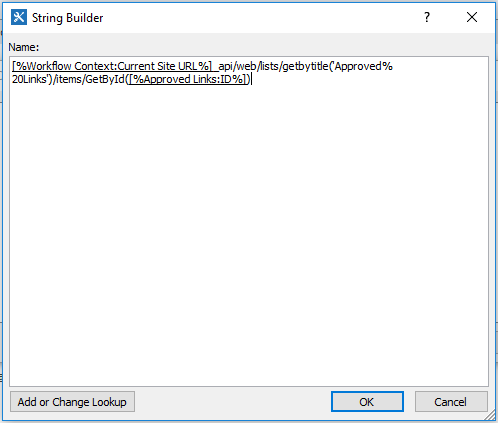
ID can be retrieved as:
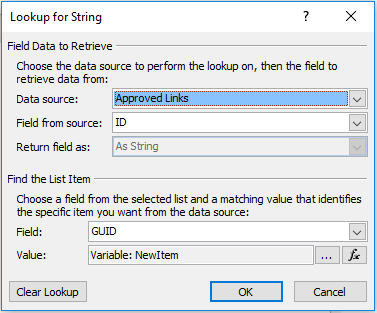
Where NewItem is GUID of item added to Approved Links, on which you want to update managed metadata field value.
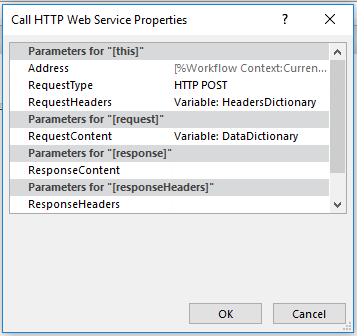
Change HTTP method to HTTP POST:

Set HTTP Web Service Properties as:
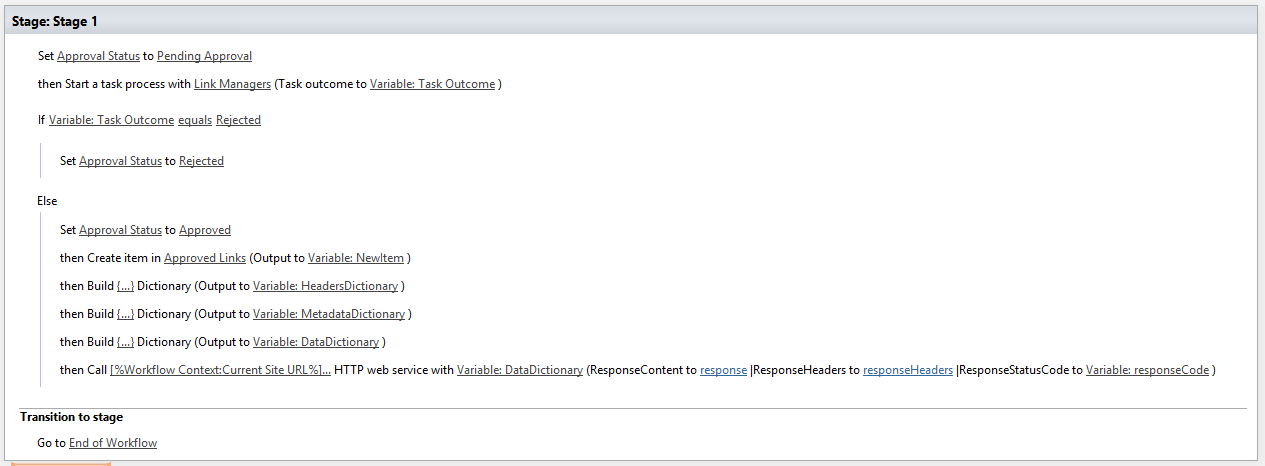
8. Publish workflow. Final workflow appears as:
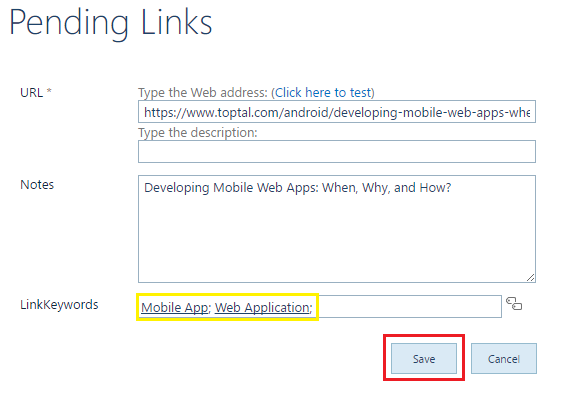
9. Add new item to Pending Links as:
10. When a new item is created, it’s approval status will set to Pending Approval as:
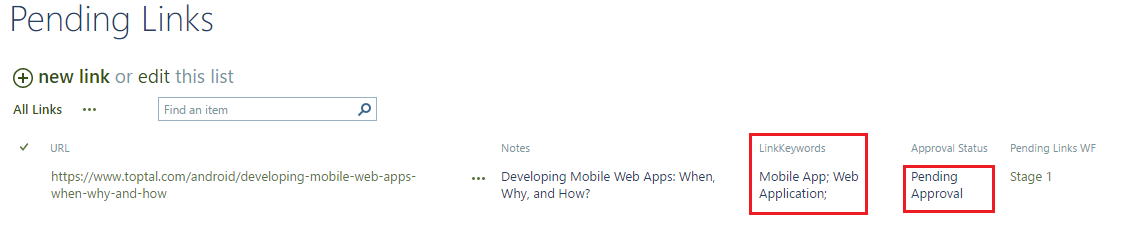
A task approval will be processed for Link Managers.
11. If link item is approved then Approval Status will set to Approved:
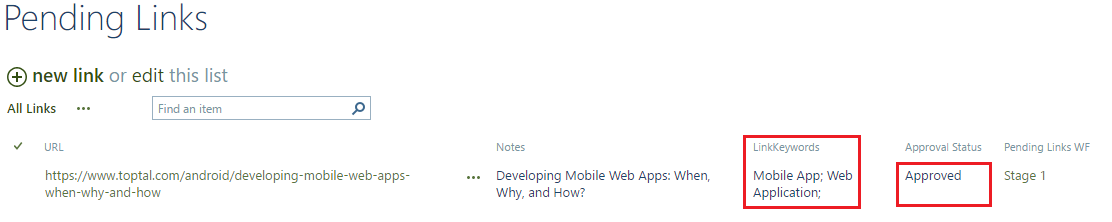
12. New item will be added to Approved Links as:
So, now using these steps you can updated managed metadata field. Hope, it was helpful to you.
How to Use Power BI Mobile Apps to View and Interact with Reports and Dashboards

Power BI makes your data travel along with you and stays connected to your data from anywhere, anytime with the Power BI app for Windows, iOS, and Android.
Power BI Apps for Mobile Devices
Power BI mobile app lets you connect to your data anywhere and anytime once you’ve created Power BI reports in Power BI Desktop, and Power BI dashboards in the Power BI service and published to http://powerbi.com/.The Power BI mobile apps apply to following devices:

Sign Up For The Power BI Service On The Web
• First, you have to sign up for Power BI service, go to http://powerbi.com/ for creating and storing dashboards and reports, and to bring your data together.
• Then to see your dashboards sign in to Power BI from your Android phone.
• In the Power BI service, tap Sign up to create a Power BI account.
• Start creating your dashboards and reports.
Viewing a Dashboard
Tap the dashboard to open it.
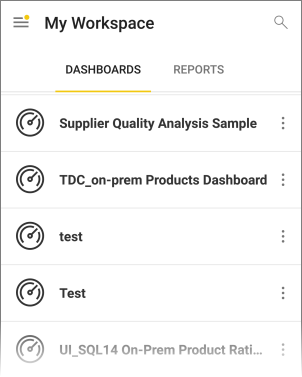
• Yellow stars show the dashboards which are put in favorites.
Power BI dashboards look a little different on your phone. All the tiles are of the same width, and they’re arranged one after another from top to bottom.
To view them in landscape mode you can turn your phone sideways.
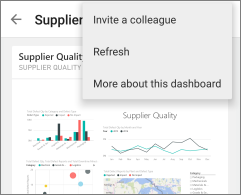
1. On the dashboard, tap the vertical ellipsis (…) next to the name to invite a colleague, refresh, and to get more information about the dashboard:
2. Swipe up and down to see all the tiles in the dashboard.
Viewing Your Favorite Dashboards, KPIs, and Reports
On the favorite page, you can see all your favorite Power BI dashboards, together with Reporting Services KPIs and mobile reports.
• Tap Favorites

• All your Power BI favorites and your favorites from the reporting services web portal can be seen on this page.

Viewing a Report
When you create reports in Power BI Desktop, you can create an optimized version for phones too.
• Open a Power BI report:
• Tap reports on the main page of the Power BI mobile app, then tap the report you want to open.

• All the Power BI reports, and Excel workbooks that you have in the Power BI service can be seen here.
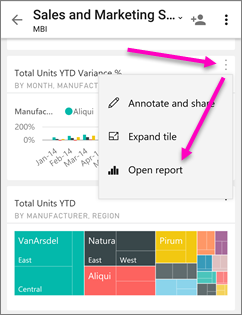
• On a dashboard, tap the ellipsis (…) on a tile then Open Report.
• To view other pages in a power BI report:
? Swipe from one side or the other, or tap the page name from the Pages icon in the lower-right corner.
To Sort a Chart
• Tap your chart, tap the ellipsis (…) and tap the field name.

Sort order can be reversed too by tapping the Sort by arrow, then tapping the same field name again.
To Filter a Power BI Report
• First, expand the filters pane.
• If you have set page-level filters in your report, then after selecting a visual you will see visual-level filters for that visual and for the whole page, page level filters will be seen.
• Select check boxes for any values you want.
• You can also switch the filtering mode by tapping Basic filtering or Advanced filtering to select values using expressions instead.
• Expressions such as are less than, is greater than, is not, and is blank is offered by number fields.
• Expressions such as contains don’t start with, and is not is offered by Text fields.

New Added Features in Power BI Mobile Apps
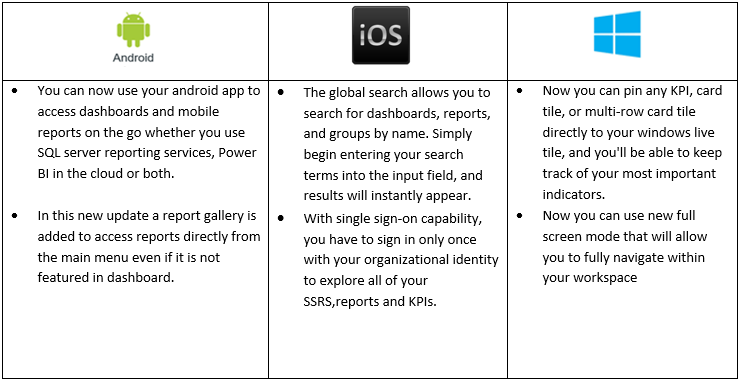
Meet your specific information needs and take better decisions with solutions for visualization and aggregation of data from across your business with our Adaptive BI solutions. Whether on your mobile, or on your intranet, our solutions enable performance monitoring, and intelligent insights. We make advanced technologies, like Power BI and automation for connecting and consolidating data from multiple sources, work for your business and purpose.
Visit www.advaiya.com/services/adaptive-bi to discover more.
Sitecore Experience Marketing Demystified

Sitecore is an enterprise-class content management system (CMS), and its Experience Marketing System (formerly known as DMS) module can advance your digital marketing practices and enhance conversions from your website. This Digital Marketing System helps bring quality leads through email, mobile, web and social channels right at your fingertips and makes information of campaign and site performance easy. Sitecore Experience Marketing System is a robust marketing solution that allows a one-stop shop for marketing data and insights for an enterprise
Sitecore Experience Analytics reports help you to categorize patterns and trends in customer interaction data, collected from websites and other data sources in the following ways:
Dashboard – provides an outline of key analytics and performance indicators
Acquisition – identifies what is driving traffic to your website, e.g., which campaign worked well and which didn’t, channel sources, target keywords, or referring site
Audience – gives you knowledge of who your visitors are, from where they landed on your website, and showcase the efficiency of your buyer persona strategies
Behavior – helps you evaluate your visitors’ actions. What pages have they visited and what have they downloaded on that page?
Conversion – gives you knowledge of what is most effective in driving customer’s attention for your product or service
Sitecore Email Experience Manager, smoothly integrates with your web platform, helps you execute targeted campaign, track performance metrics, perform marketing automation and personalize the content. Some of the exciting features are:
- It lets you customize your customer information and send email dynamically across customer segments
- It also provides information about the entire customer journey, starting with email open rate and click-through to website actions and engagement, goals and conversions
- Allows you to define an end to end campaign workflows by identifying the right actions and scheduling it to trigger at the right time
- Allows you to test every single component of a campaign to establish and improve customer engagement
Another element which makes it a hot cake is its seamless social integration by making social conversations part of the connected customer experience. There are a variety of powerful solutions to help you make the most out of your corporate social media, starting from allowing social communities on your website to connecting social data to drive most relevant and exceptional customer experiences across channels.
Sitecore Experience Marketing System has the power to take your web presence to the next level. Its advanced analytics can be very helpful to identify the visitors and thus converting them into leads. It can deliver everything from basic analytics to sophisticated email campaign management with the highest level of customizations. In this way, marketers can achieve content, analytics, testing, email, personalization, and automation in the same interface and can track all the data at a single location, thus avoiding the need for various platforms and unnecessary administrative work for your marketing team.
O365 vs GSuite – Which is Best For Your Business?

“Productivity” and “Collaboration” are the two buzz words in every industry today. As consultants, everyday we learn about the vision for increasing the productivity and workforce efficiency from the top management of many industry leaders which explicitly calls out for a single platform to collaborate. For instance, more than one employee working on a single document, communicating with each other simultaneously over chat, making iterations is a very typical example of collaboration. In other words, parallel execution of tasks with efficiency leading to higher productivity is collaboration.
The two industry rivals, Microsoft and Google, have been proactive in pushing and promoting their cloud business productivity as a leading collaboration tool. Microsoft’s Office 365 has been a known cloud solution amongst market leaders, whereas Google Apps (now G Suite) has managed to attract start-ups and small-scale industries. Two factors, reach and price has played a significant role here, Google wins on price and Microsoft wins on its reach. Beating Microsoft Office is very tough for any other business tool with similar capacities.
There is a list of features and functionalities which are common, and some which have been the key differentiation points between two solutions, giving advantage and disadvantage over each other.
|
Feature |
Microsoft Office 365 |
Google Apps for Work (G-Suite) |
|
Offline Applications |
Traditional offline Office applications are available to be installed and used locally on PC and MAC |
No Offline versions, Google Docs, Sheets and Slides could be used only online |
|
Cloud Storage |
Microsoft provides 1 TB of space in OneDrive as Cloud File storage, for each user |
Google Apps provides 30 GB space on cloud for file storage and email storage. However, google provides unlimited storage for accounts with at least 5 users on $120 per user per year plan |
|
Email Services |
Exchange Online provides a separate 50 GB of inbox for every user |
No separate space for Gmail, shares space provides with Google Drive i.e. 30 GB per user |
|
Collaboration Platform |
SharePoint Online – Cloud platform for collaboration and intranet solutions |
Sites – cloud platform for collaboration |
|
Online Meeting & Instant Messaging |
Online meeting through Skype for Business (maximum 250 Users). Enterprise plans allows PSTN configuration and Hosted PBX. |
Online meeting through Hangouts (maximum 25 Users). No Hosted PBX or Voicemail available |
|
Enterprise Social |
Yammer |
Google+ |
A study by Okta Inc. showed that Finance and Construction sectors are pretty much inclined to use Office 365, whereas Marketing firms look confident and happy with Google Apps. A screenshot of stats below:

Image Source: Oka study on “Business @Work, March 2016.”
Apart from the complex figures and comparison, Microsoft leads the race on the nature of innovation in the simplest form, which has been not appealing in G Suite. Recently introduced Flow, Stream, Planner, Delve, and Team are such small yet powerful services additions in Office 365. Stream appears to be Youtube for Enterprises whereas Flow allows people to build actionable workflows by their own without knowing a piece of code. G Suite has been typical of the services included in the package, and not much increment or innovation was seen, apart from “Android for Work” which shall be appreciated by enterprises for mobility.
To conclude, Google apps has attracted businesses that need basic functionalities and features; most of the industry owns Office 365 due to trust, familiarity and compatibility with Office applications. On commercials aspects, G Suite wins the race by keeping two simple plans for any number of users; Office 365 has six variety of plans targeted to different user group and features.