Table of Contents
Microsoft Azure SQL Database is a managed cloud database (PaaS (Platform as a Service) service provided as part of Microsoft Azure which runs on a cloud computing platform, and access to it is provided as a service, i.e., PAAS (Platform as a Service). This type of managed database service takes care of scalability backup with high database availability and does not require any version upgrading or patching process. Also, we do not have to even think about any hardware issues or other factors like CPU capacity (number of cores), RAM, hard disk, and licenses (Express, Standard, Enterprise). We just need to consider DTUs (Database Transaction Units) and the size of the database in on-premises. So, the capacity of the database is calculated in DTUs.
Basically, the Database Transaction Unit (DTU) is the unit of measure in the SQL Database.
For Example: If any of the customers have asked, how do we arrive at the required DTUs for our Database server if we need to migrate to Azure from On-Premises, then here is the tool named "Azure SQL Database DTU Calculator" that is used to calculate the required DTUs.
In short, for simplicity, the DTU model has the advantage of lower price and accuracy of measurement for data while doing the migration, so you can get started at a lower price point with this model.
How to use DTU Calculator? Measure resource utilization
To measure the DTU Size for your database server, you will need to capture several performance metrics on your SQL server. To provide the most accurate measurement, you must run the respective production workload during a time period of at least 48 hours that captures the expected range of usage. Measure the following utilization metrics for at least 48 hrs. So the calculator can check the utilization over time to provide you the best recommendation:
- Processor - % Processor Time
- Logical Disk - Disk Reads/sec
- Logical Disk - Disk Writes/sec
- Database - Log Bytes Flushed/sec
To capture the correct performance metrics, use one of the following utility and scrip (Command Line EXE or PowerShell Script) to capture your database utilization for 48 hrs. period at least. Need to take care following while running script in your production environment:
- 1. Before running the utility/script, ensure that no processes other than SQL are utilizing CPU, memory, and disk.
- 2. Click the link and download the zip file onto your SQL server and extract the contents.
- 3. If you are using the command line utility, right-click the .exe file and select "Run as administrator".
- 4. If you are using the PowerShell script, navigate to the Windows PowerShell ISE and right-click to "Run as administrator". Within Windows PowerShell ISE, browse to the SQL-perfmon.ps1 script file and click 'F5' to run the script.
Related: Creating a schedule to run a SQL stored procedure from PowerShell script using Azure automation
Assessment Demo of Azure SQL Database DTU Calculator.
Step-1: Go to the DTC Calculator web page and download either method to collect the on-premises database performance counter utilization. Here in this example, we will use the Command Line Utility by using the Download Command Line Utility option.

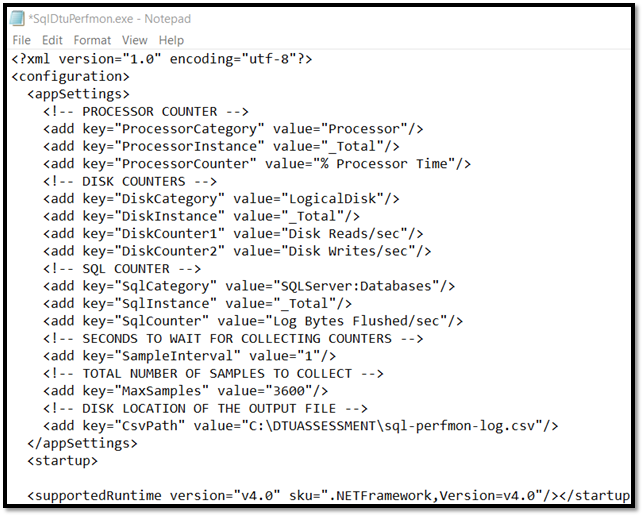
Step-2: For Changing Parameters: Here, the default Counters are collected at 1-second interval for 1 hour or 3600 seconds (about 1 hour). If you want, you can change these parameters, and the log file will be created as C:\sql-perfmon-log.csv. To change these parameters, you can use the SqlDtuperfmon.exe.config to change the settings shown below.

Step-3: Upload your performance .csv file and fill in the no. of CPUs, and Click Calculate

Step-4: Review Analysis & Result: After clicking on the calculate button, you must review the charts which provide an analysis of your database resource consumption. The charts show the % of time (based on your measurements) of your database's resource consumption at each level. You can review CPU, Input-Output Operations, and Log individually as well as collectively to better understand which metric(s) affect the performance of your database. Here is the chart which shows the SQL Server performance utilization for CPU, Input-Output Operations, and Log. The Service Tier/Performance Level chart represents the frequency of time your database workload falls into the indicated service tier and performance level. The DTUs Over Time chart represents the database throughput unit (DTU) calculated during your different hours

Also read: Event and trigger in Azure Blob storage


