SharePoint 2016 and Project Server 2016 installation: For small production environment using single server farm
In a traditional farm topology SharePoint, the common architecture in small and medium-sized environments is the two-tier design. This design utilizes two servers: one for the web front-end and application services and the other for database services with separate Active Directory Server. Now with SharePoint 2016, we have – MinRole, which is very similar to the other topology designs that we have been using with SharePoint 2013. We will discuss more about MinRoles while we install the same. [ Empower executives and employees across your organization to connect, converse, discover and work together at one central location to save time, increase productivity and boost engagement Know more at: Office 365 Based Intranet ] Here, we are installing SharePoint server 2016 along with Project server 2016 in a single server farm environment, where we have separate Active Directory and separate SQL Database server that is well suited for any small or medium-sized environments. Before proceeding to install SharePoint server 2016, we need to make sure our environment meets all of the pre-required configuration. MORE RELATED ARTICLES HOW TO EXPORT AN OUT OF THE BOX (OOTB) LIST VIEW WEB PART IN SHAREPOINT HOW TO DEVELOP & BIND CUSTOM TEMPLATE WITH CUSTOM CONTENT TYPE IN SHAREPOINT Software and Hardware Requirements- Along with the above requirements, Microsoft SharePoint products also require to install the following on a server farm: o Windows Management Framework version 3.0 o Application Server Role o Web Server (IIS) Role o Microsoft .NET Framework 4.5.2 o Update for .NET Framework 4(KB2898850) o SQL Server 2012 Service Pack 1 Native Client o Microsoft Identity Extensions o Microsoft Sync Framework Runtime v1.0 SP1 (x64) o Windows Server AppFabric 1.1 o Windows Identity Foundation v1.1 o Microsoft Information Protection and Control Client (MSIPC) o Microsoft WCF Data Services Service Account Requirement: Account Account Name and Purpose Requirements Server farm account or database access account We are using the username – SPAdmin The server farm account is used to perform the following tasks: SharePoint Products Configuration Wizard Configure and manage the server farm. Act as the application pool identity for the SharePoint Central Administration website. Domain user account Member of the local administrators group on each server. SQL Server login on the computer that runs SQL Server. Additional permissions are automatically granted for the server farm account on Web servers and application servers that are joined to a server farm. The server farm account is automatically added as a SQL Server login on the computer that runs SQL Server. The account is added to the following SQL Server security roles: dbcreator fixed server role securityadmin fixed server role db_owner fixed database role for all SharePoint databases in the server farm Install SharePoint prerequisites: • Login into the server with SPAdmin user. • Download and install SharePoint prerequisites from the SharePoint 2016 setup. • Run the setup as administrator, and choose install software pre-requisites. • Click on Next. On the next window, select “I accept the terms…” and click on Next. • Click on Finish to restart. After restarting, the pre-requisite tool will resume with the remaining installation. • After the installation is completed, the summary screen will show the status as below: • Click onFinish • Click on Install SharePoint Server. • Enter the Product Key and click on Continue • Click on “I accept the terms…” and click on Next • Choose the file location where you want to put your SharePoint configuration file. • Once the installation is done, click on Closeto start the configuration wizard. • When the SharePoint is installed, you will automatically be prompted to run the SharePoint 2016 Products Configuration Wizard, click on Next. • Choose Yes to restart the services and continue with the configuration wizard. • Select Create a new server farm option, and click Next. • On the next page, enter the configuration database name, database server name and user account details and click Next. Now you will get a new specific server role wizard which is also known as ‘MinRole’. In the earlier version of SharePoint, for a large SharePoint deployment plan, you needed to install SharePoint services with specific roles. For example, if you wanted all your end user requests to be placed on one server, then Web Front-End (WFE) server was used to handle your end user requests and similarly for the APP server, Search server, and Cache server. This complete process was quite complex and time taking. Now, you no longer have to worry about the services which should be started on which servers. By deploying your farm in a recommended MinRole topology, you can focus on what functionalities are needed to be enabled in your farm and let SharePoint take care of the rest. SharePoint 2016 server have six server roles as following: • Front-end: Services and components that serve for end user request are placed on web front end roles. • Application: Services and component that serve backend request like search crawl request are placed on application roles. • Distributed Cache: This role is assigned to servers to load balance end user requests among the front ends. • Search: This role is for services and components that are responsible for search indexing and crawling. • Custom: This role is reserved for services that needed to be isolated from other 3rd party application services. • Single-server farm: It doesn’t include SQL Server express. It includes all service application, services and components required for a single server farm. It is meant for the development, testing or small production environment. The first five roles are for multi-server farm environment and the last role is for a single server farm. Please note that while you select ‘Minrole’, either it would be a multiple server farm or a single server farm. If you are selecting a single server role here, then you will not be able to extend it into multiple server farm in future. Specify a port number for the Central Admin or you can use the default one. Also select the NTLM installation mode at this point, and press
SharePoint List Workflow: Create or update list item on another SharePoint site list
Recently, in one of my projects there was a requirement to create a SharePoint list workflow that triggers when an item is created, and that should result in creating a new list item on another SharePoint list which is created on some other SharePoint instance.
I knew the default copy list item activity will not work in this scenario as both lists are not on the same SharePoint site. The straight forward solution to this on top of my mind was to use ‘Call HTTP Service’ activity by calling SharePoint REST services with POST method, and create the item on another list. But this required to run the workflow with elevated permissions.[ Empower executives and employees across your organization to connect, converse, discover and work together at one central location to save time, increase productivity and boost engagement Know more at: Office 365 Intranet ]
In this blog, I will first talk about the required configuration to do this cross site stuff and then brief out the steps to call the SharePoint Rest Service:
Enable workflow elevated permissions
– Below are the high-level steps to do enable the workflow:
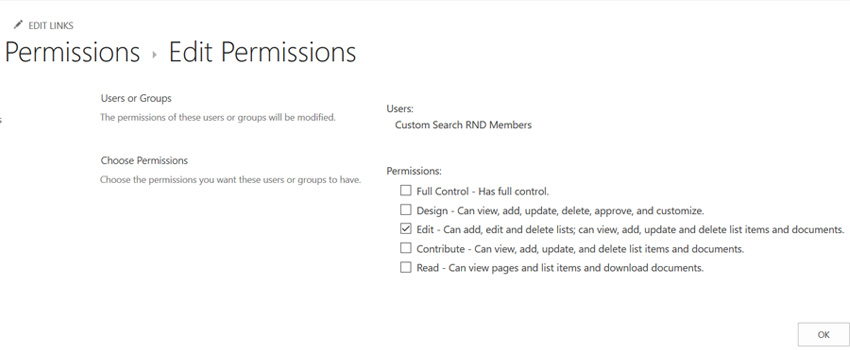
- Allow the workflow to use app permissions in a SharePoint Server 2013/Online site.
- Grant full control permission to the workflow.
- Wrap the call action inside app step.
You may follow the detailed steps from Workflow with elevated permissions by using the SharePoint 2013 Workflow platform
Note: You will need to enable the workflow elevated permissions on both the sites. I followed the below process:
- Get the App Id from the first site where the List workflow is created to Call HTTP Service as below
- Go to Site Settings, under Users and Permissions, and click Site app permissions.
- On the permission page, the App Identifier column displays the value. Here, copy the GUID value before @ symbol.

- With this App Id, enable the workflow elevated permissions where the SharePoint List workflow is created using this link – Workflow with elevated permissions by using the SharePoint 2013 Workflow platform
- Navigate to another SharePoint site where the list item is to be created [Note: This is required only when your lists are not on same site/site collection]
- Use the App Id you get in step 1 from first site and perform step 2 on this site.
Get the target metadata type for HTTP Call:
To do this you need the Odata service URL of the list where you need to create the list item. Use the below link and replace placeholders with actual values
https://<site>/<web>/_api/web/lists/getbytitle(‘<ListTitle>’)/items
Navigating this link displays xml/json in this search ‘<category term=’. Copy the value of term attribute from here.
Now you are done with the required configurations to use Call HTTP Service activity to create item on another SharePoint site list.
For calling the SharePoint REST Service, you may refer this link – Using SharePoint REST services from workflow with POST method, which greatly helped me to quickly configure the workflow.
The changes to do in the created workflow are:
- Use the service URL https://<site>/<web>/_api/web/lists/getbytitle(‘<ListTitle>’)/items of another site where you need list item to be created.
- Keep the ‘Call HTTP Service’ activity in the App Step.
- While configuring the Build dictionary which we call metadata, the type value should be the term value you get in the section ‘Get the target metadata type for HTTP Call’ instead of SP.Data.WorkflowItemsListItem
Once you are done with this, save and publish the workflow. Now your workflow is ready to test. When you create/update (depending on your configuration) a list item in current SharePoint list, it will create a list item in another SharePoint site list, the URL of which you configured in the workflow.
And this way you can update the list items on external SharePoint sites. Note that this process works on SharePoint 2013 List workflows only, as earlier versions do not have Call HTTP Service activity available.
The evolving scope of Business Intelligence

In the current market, every organization is facing stiff competition, demand for operational efficiency and business productivity. Organizations are becoming innovative in their approach to making business truly performance-driven at strategic, tactical as well as operational levels. In this prospect, Business Intelligence (BI) can help businesses promote their competitive edge with better tools to discover, distribute and analyze metrics, and turn data into actionable insights while accessing new data about the competition.
BI is evolving in every industry. The scope has expanded to more than just a set of standard, SQL-based reports. Here I talk about four changes that have advanced BI into a self-service, graphical, collaborating world.
1. Today, BI is no longer exclusively owned and managed by IT.
This is an optimistic change as it lets the business take an active role in BI procedures and practices. With various desktop BI tools such as Tableau, Tibco Spotfire, and SAP Crystal Reports, it is now possible for users to have all the capabilities on their desktops, which were previously limited to the enterprise-level toolsets. These tools have given users more flexibility to discover and realize how new reports should be generated and organized at the enterprise level.
2. New, powerful BI tools washes out the paradigm of confining users to the reports they have been given.
In many organizations, users now have the facility to explore raw data and create valuable reports. Of course, there are still limits on how many system resources a user can consume and security settings still ensure users can only access data for which they have permission. However, it is definitely going to help users experiment with raw data, metrics, and create a new view of data leading to new innovations.
3. The outbreak of advanced visualizations and dashboards have also transformed the landscape.
The variety of graphics available has gone well beyond the standard tables, bar graphs, and pie charts. In addition, traditionally where graphics used to be mostly static or drill-down enabled, now graphics/charts can be linked together so the users can interact with the data in real time. For example, clicking on one country in a map might automatically filter the data on all other components of a report to reflect only the information of that country. This flexibility enables faster insights.
4. BI tools are no longer limited to only customary SQL logic.
Many BI tools like Tableau include more advanced analytics such as predictive modeling algorithms. The growing use of NoSQL processes via platforms such as Hadoop and Teradata has changed the scenario. These NoSQL platforms have increased the types of processing that can be applied to raw data before it is passed to users via a BI tool. BI process can now include complex and iterative programming. This widening of the scope of analytic processing increases the possibilities that can be explored.
Conclusion
Considering all these changes, modern business intelligence landscape seems much more advanced than it used to be, blurring the line between the roles of IT and business users. As deep analytic tools are enhancing their capabilities in reporting, visualizations and dashboards, reporting tools continue to add deeper analytics.
At first, this evolution can be bewildering, but the businesses who go ahead making themselves comfortable with the new realm instead of resisting it will find it well worth their while. To realize the impact of new methods of doing things, organizations need to experience them by adopting.
Create calculated measures in Power BI desktop

Power BI Desktop gives you the right way to deal with your data in just a few clicks. However, the data does not contain everything you need to create reports. This is where measures come into play and will certainly help you to get most out of Power BI.
You can use measures in the most common data analysis, such as sums, averages, counts or in advanced calculations. With the help of Data Analysis Expressions (DAX) formula, you can create a measure having calculated in response to your data and interaction with your reports. This article is for Power BI users already familiar with using Power BI Desktop to create more advanced models.
Insight on measures
The Power BI desktop allows you to create and use measures in Report View or Data View. The created measures appear in the fields list with a calculator icon. Measures can be named with any required name based on your choice, and further you can use visualization for a better look and feel.

Measures calculate a result using DAX formula, which includes various set of functions, operator, and constructs giving elasticity in creating measures to calculate results for data need. DAX formulas are bit similar to Excel formulas and have many of the same functions like DATE, SUM, and LEFT. However, DAX’s functions are calculated with relational data like in Power BI Desktop.
Example: Create your own measure to calculate variance
Let’s try out an example of creating a measure to calculate variance of two columns from a table “Total Sales”. One column represents the sum of total amount for this year and other the sum of total amount for last year, so now we will create two measures having sum of both columns and the third measure will represent the variance of last year vs this year.
Let’s start with creating measures and their respective visualization.
1. Start with creating a new measure by clicking on the New Measure button in the ribbon on Power BI Desktop’s Home tab.

Once you click, a formula bar will appear on the top, this is where you can rename and enter a DAX formula for our measure.

2. As in this case, you are calculating the Total Sales Revenue for This Year and Last Year. So, first create a measure to calculate the Total Sales for This Year by dividing the Sum of Sales Amount TY by Sum of Sales Units TY. This DAX equation will give the total sales for TY.

3. After calculating the result, represent the values using Bar Chart visualization. You can simply drag the Total Sales TY field from Total Sales table to chart values.

You can easily visualize the calculated data of a created measure.
4. Now create a second measure calculating the values for Total Sales Last Year. Similarly, divide the sum of Sales Amount LY with a sum of Sales Units LY to get the values for Total Sales LY.
![]()
5. Now to show the slight comparison in the bar chart, you can simply drag the Total Sales LY filled from Total Sales table to the same chart under values section.

You can visualize the comparison between total sales last year and this year in chosen bar chart.
6. Finally, to calculate the variance of above calculated fields, create a new measure named as VAR Total % or you can rename the measure accordingly. This measure will calculate the variance percentage from the created measure fields Total Sales TY and Total Sales LY.
![]()
7. You can highlight the calculated values using Card item from Visualization. Simply drag the VAR Total % under visual level filters. The card will represent the Variance of Total Sales This Year Vs Last Year.

You can play with visualization of a card using format pencil icon and change the color combination, length, height, background, etc.
Few important tips on measures:
1. To create a new measure under the same table, you can either select New Measure from the ribbon or right-click on table in the field list, and then click New Measure. This will create your new measure under the same table, where it will be easier to find.

This expression will give you an error in case of having zero value in either of the columns.
Note: You cannot divide the columns containing zero values.
3. You should use appropriate parenthesis while creating a measure. In most cases, users will face Syntax error due to missing or misplaced closing parenthesis.
This blog emphasizes the power of measures giving the results desired from the data. As illustrated, you can name measures as it makes sense to you, and you can easily use the table suggestion list to find and select the right element to add in our formulas. Further, you can use them in your report canvas with better visualization and results.
SharePoint 2016 migration checklist

In a previous blog post I discussed new and improved SharePoint 2016 features, migration paths, and hardware/software requirements, when preparing for SharePoint 2016 upgrade. Here I share a checklist that would help you confirm that you follow all steps necessary to prepare for an upgrade, start the upgrade, and perform post-upgrade steps.
The basic steps are discussed as under –
- Prepare detailed inventory of environment
- Clean up old environment
- Test content
- Prepare destination environment and analyze new environment configurations
- Communicate with users
- Start migration
- Read only mode until migration completes
- Post migration, third party tools and resources
Prepare detailed inventory of environment
It is always beneficial to have a detailed inventory of all assets and customizations. This helps in making better decisions and estimates as you prepare for the migration process.
Clean up old environment
Prior to the upgrade, it is essential to clean up the old environment including any unnecessary data, web parts, etc. It may take some time but it allows you to get away with any orphaned sites/data and re-organize useful things.
Test the process
This stage includes testing all the components to check all things are well-organized or if there are any issues there in.
Prepare destination environment and analyze new environment configurations
This step includes planning and structuring new home, according to the requirements:
- Mapping destination’s architecture
- Optimization of new SharePoint server’s performance
- Configuration of all web applications
- Back up everything
- Checking databases for corrupt data and run a test migration
- Mapping a plan for the metadata of content
Communicate with users
Persuading users to accept the migration is one of the major challenges. To make it successful, you will need to make sure they know what is going on and why. Share estimated timeline of your migration efforts.
Start migration
- If migrating from SharePoint 2013 on premises, perform database attach upgrade to bring everything “as-is” and use a third party tool to granularly migrate and restructure as you move.
- If migrating from an earlier SharePoint version, strongly consider third party tools. The use of these tools, combined with “Paragon’s SharePoint & migration expertise”, will help any client gain control over their migration & help them put in custom efforts suiting the needs.
Read only mode until migration completes
Putting the system in read-only mode until migration completes is also an important aspect. This ensures that the product is delivered only when it is ready, and no room for confusions.
Post migration, third party tools and resources
The post migration process includes time to time review, regular communication with users, and efforts involved in making the migration successful.
Preparing for a SharePoint 2016 migration

As SharePoint server 2016 is released, SharePoint migration has become a hot topic for many organizations. SharePoint server 2016 has come with many enhancements, encouraging organizations to migrate to this new version.
What are the new and improved features in SharePoint?
I have listed the major add-ons in SharePoint 2016 over the previous versions as below:
- Cloud accelerated experiences
- Easier hybrid features and experiences available for easier upgrade
- One Drive for Business and Delve
- Predictive analytics
- File sharing improvements
- File size is increased up to 10GB for uploading purposes. Earlier, it was around 2GB
- Durable links
- Document connectivity through One Drive
- Size of content databases reach TBs>
- Improved user experiences
- Improved mobile experience
- Personalized insights
- Zero downtime patching
- >Data loss prevention capabilities
Possible Migration Paths
- Direct upgrade from SharePoint 2013 to SharePoint 2016, as hinted by Microsoft.
- Upgrade from SharePoint 2010 to SharePoint 2016- As direct migration from SharePoint 2010 to SharePoint 2016 is not yet confirmed, migration from SharePoint 2010 to SharePoint 2013, and then from SharePoint 2013 to SharePoint 2016 is an option without much hassle.
Moreover, there are two possible ways – Clean install versus In-place upgrade
- Perform an in-place upgrade- According to Microsoft, SharePoint 2016 can be installed directly on the top of an existing installation of SharePoint 2013.
- These migrations consider that organizations are not moving wholesale to office 365.
- Many of the users are still operating on on-premises.
- Organizations having older versions of SharePoint, i.e. other than SharePoint 2013 will need to perform “leapfrog SharePoint migration”. This technique includes-
- Upgrading from SharePoint older version to SharePoint 2013.
- Then, upgrading from SharePoint 2013 to SharePoint 2016.
- Clean Installation- The second possibility is “clean installation”, attaching a content database from previous SharePoint deployment.
- This process is relatively straight forward and is same as the process for upgrading to SharePoint 2013 from an earlier version.
The process goes as this –
- The first step in the migration process is to create a SharePoint 2016 farm.
- As the new SharePoint 2016 farm is created, the content databases be copied from SharePoint 2013 to SharePoint 2016 and attached.
- When the attachment is done, the administrator should then upgrade any service applications, and also upgrade the content databases.
- Finally, the site owners would need to upgrade their site collections.
Below are the hardware and software system requirements to install and run SharePoint 2016:
Hardware Requirements: –
Database Server- 64-bit processor (4 cores), 8-24 GB RAM, 80 GB Hard Disk
SharePoint Server- 64-bit processor (4 cores), 8-12 GB RAM, 80 GB Hard Disk
Software Requirements: –
Database Server- Windows Server 2012 R2- with latest updates
SharePoint Server- Windows Server 2012 R2- with latest updates
Hope you find these installation details helpful. You can also read my blog on SharePoint 2016 migration checklist, which may help you in preparing for a SharePoint 2016 migration.
Produce insightful and interactive reports with Power BI for Project Server

Pictures are worth a 1000 words. This hold true whether you are giving directions to your favorite pub or presenting the status of your projects to your key stakeholders and sponsors. Every time you are in front of your executives you want to impress. So it goes without saying that you want to impress your executives when presenting your project details.
The ideal report and dashboard need to accurately convey your project metrics while being interactive, which allows management to explore the data to derive deeper insights. With today’s technological advancements and always connected devices, organizational leaders expect to access and share these reports and dashboards within a few clicks. Of course, you don’t want to spend all day or randomize your key resources writing code to create the reports. Power BI allows you to quickly visualize project details, review project health, resources utilization, and more through the use of a simple OData Service. And all this, without the need for technical coding skills.
To make Project Online (or Project Server) reports and dashboards in Power BI we simply establish an OData connection. Then we select the tables and fields we want to be part of our report. Finally, we choose the visualization that brings our reports to life. With Power BI we also have more advanced capabilities such as creating custom calculated fields and key performance indicators.
Looking to gain more information about Power BI reports and dashboards, its features, and how to use visualization for creating interactive dashboards? Register for the upcoming live demo on October 25, 2016 on Advanced Power BI reports on Project Server Data and quick-start business intelligence reports and dashboards from Microsoft Project Server/Project Online.
Access the previous webinar recording on Make Reporting Better – Power BI Reports & Dashboards for Project Server held on June 14, 2016, by Darrin Lange, director of operations and project management at Advaiya Solutions Inc.
Power BI helps in creating intuitive reports and dashboards that you can easily create and share. However, it only adds value if the features are used effectively. Some important features of Power BI are:
1. NQL: NQL termed as Natural Query Language is a very powerful feature of Power BI, where we explore our data using intuitive, natural language capabilities, and receive answers in the form of charts and graphs.
2. Sharing Dashboards: It allows sharing dashboards with colleagues, whether inside or outside the organization. It also allows for colleagues to re-share the dashboards.
3. Importing visuals in Power BI: It facilitates easy import of various visualizations available in Power BI Visual gallery.
4. Creating group workspaces: Creating a group in Power BI helps you collaborate on your shared reports, dashboards, and datasets.
SharePoint 2016 – new, improved and deprecated features

Unlike the early days of the Web, today, content management system (CMS) is a combination of multiple tightly-integrated systems. CMSs are evolving everyday with new features. The SharePoint 2016 is the best example of it, where the technology is bridging the gap between the data residing inside organizational premises and that outside it along with the implementation of viewership and rights to it.
SharePoint 2016 has evolved in capturing, storing and maintaining large volumes of data. The changes made and the new features list is quite vast; however, here I explain some of them which may come handy.
Benefits of cloud based load testing


Standard on-premise testing can no longer provide the required level of performance surety essential to compete in the current global marketplace. Cloud based testing tool can be leveraged to evaluate the performance of the application from any geographical location. The performance tests can be run with the load generators/agents across any location with hundreds of thousands of users.
Cloud based load testing gives you complete load testing flexibility in both development and production environment. Tests can be conducted quickly and continuously with real-time insights of end-to-end performance. It helps in determining how fast some aspects of a system work under a particular workload regarding responsiveness and stability.
Below are some of the several benefits of cloud based load tests that enable thorough testing of business-critical applications without breaking the bank.
- Ease to use: All you need to get started is a Team Foundation Service account. You can simply connect to this account from Visual Studio and get started instantly, without any pre-requisites.
- On-demand scalability: This property allows to increase or decrease the user load/test load to configure as per the production requirements, whether from 1000 to 5000 users or from 5000 to 50 users. Such scalability enables you to measure the actual performance of the application and allows you to create a replica of the production environment.
- Same tests work on-premises and on the cloud: All tests you have authored on-premises -load tests, declarative web performance tests, coded web tests or unit tests, can be run on the cloud.
- Real world condition and load: It covers all ideal conditions for testing behind firewall, third side traffic, disconnection and DNS errors, which you can never find after deploying your application on a live production server. It also covers other values as response time, throughput, and average page time, among others. Cloud testing makes use of cloud-computing resources in order to simulate real users who come directly from the Internet.
- Save capex or space: It reduces the capital expenditure with the following added advantages:
- No need to buy new hardware; same hardware can be used.
- No support engineer needed for hardware.
- Save time: It involves fewer efforts and thus saves time.
- Agility: Cloud testing allows you to run tests from anywhere. This allows flexibility in scheduling task and reducing the risk of failure as it provides the testing environment up to the breakdown points.
- Get deeper insights about performance: You can get complete server and client diagnostics when you simulate real-time load patterns for your application.
- Free load testing: Cloud based testing using Visual Studio allows 20,000 virtual user minutes per month to load test at no extra charge.
Most enterprises have made significant investments in data center infrastructure, which directly impacts the capex. Thus, the cloud is a better approach to save capex.