Stop emails from spam with the Email Before Download plugin

Are you still struggling with the problem of emails going into spam while using Email Before Download (EBD) plugin for WordPress? If you are looking for an actual solution, here you go! Mail is marked as spam due to various reasons, and some of them are links in the email body, spam text/words in the email body, downloadable link, attachment, and much more. In the case of EBD, we have a solution. The idea is to change the dynamic URL in the email. With the help of code, change the URL which is sent by EBD into email body and upon click, rewrite the URL to the desired format of EBD using htaccess file. The most probable reason for getting such emails marked as spam by the firewalls is the terms used in the text. With this approach, the spam issue gets resolved and email lands into an individual’s Inbox. With the EDB plugin, the dynamic URL being generated is of the format: www.example.com/email-before-download/download.php?i=xyz and below are some steps to rewrite such URL in case of EBD: 1. Open email-before-download.php plugin file from plugin directory 2. Go to line # 531 where URL variable used contains the URL like $url = WP_PLUGIN_URL.”/email-before-download/download.php?dl=”.$uid; Change this using the below code: $url = site_url().”/downloadable/”.$uid; 3. Save file 4. Open .htaccess from root folder of your website Add the below code at the end: RewriteRule ^downloadable/([^/]*)$ wp-content/plugins/email-before-download/download.php?dl=$1 [QSA] 5. Save this file 6. Now refresh/reload page where download form is used. Fill the form and check if the email is sent into inbox. Hope this helps and if you still facing any issue, please add your comment below or write to me athemendra.ajmera@advaiya.com and we can try to fix it.
Configure Project Server custom fields with PowerShell

In my previous blog I talked about a complete PowerShell script for creating custom fields and one level lookup tables using Project Server PSI services. The uncovered part is to create a Graphical Indicator custom field. So, here I will be explaining how to add a graphical indicator custom field in project server. In the XML file, which contain the detail for adding the enterprise project server fields the structure for representing the graphical indicator is Thus, to create a graphical indicator We have used an attribute IsIndicator whose value need to be set as “Yes” . Add the child which will contain the Indicator value to be displayed and the Image ID of the image to be used for that value as indicator. To get the Image Id for the values perform following steps: Login to PWA Go to Server Settings->Enterprise Data->Enterprise Custom Fields and Lookup Tables->New Custom Field On New Custom Field page under Values to Display select Graphical Indicators. Do F12 of the page and then expand the image dropdown and using the Select Element option of the F12 window select the required image icon. The corresponding image information will get highlighted. To get the image ID for creating the custom field we must increase the image index value by 1. e.g. In below screenshot the name for cross image is cf_54p.png. So, the Image Id to be used for PowerShell scripting will be 55. The PowerShell script for adding the graphical indicator is as follows: if(-Not [string]::IsNullOrEmpty($customField.IsIndicator)) { if ($customField.IsIndicator.Equals(“Yes”, [System.StringComparison]::CurrentCultureIgnoreCase)) { $IndicatorList=”” foreach($Invalue in $customField.Indicator) { $IndicatorList =$IndicatorList+”[[== “+$Invalue.Value+” ][“+$Invalue.ImageID+”]]” } $customFieldRow.MD_PROP_GRAPHICAL_INDICATOR=$IndicatorList } } In above code if the IsIndicator attribute value for a custom field in the XML has the value “Yes” then it is an indicator custom field. To set the indicator values to be added we parse through each of the Indicator child and generate a string assigned to $IndicatorList variable which is then assign to MD_PROP_GRAPHICAL_INDICATOR property of custom field row. Now the import part is the string we are creating for the indicator values to set. +“[[== “+$Invalue.Value+” ][“+$Invalue.ImageID+“]]” The string is formed as First put 2 open square brackets then 2 equal to (=) sign. After that give a tab space and add the value to be displayed. Then give 2 tab spaces and a closing square bracket. Opening square bracket and the Image ID to be displayed. At last 2 closing square brackets. If tab space does not work in the PowerShell IDE. You can create the string using a text editor and paste it in your script. Thus, your graphical indicators will get easily added with these simple steps using PowerShell scripting. Hope my both blogs were helpful to you. Happy PowerShell Scripting!!
Configure Project Server custom fields using PowerShell

Working with Project Server many a times we come across a requirement of creating numerous custom fields and lookup tables which is a time-consuming job. To, overcome this I will be sharing with you how to create an automated script using PowerShell script. I have used Project server PSI services which will be complied in the script itself to generate an assembly to carry out the operation. The same operation can be accomplished with CSOM also but due to limitation of not creating Graphical Indicator fields used PSI services. The complete PowerShell script is attached and comprises of 3 files. Below are the details: File Content Deploy-Config.PS1 Contains details of Project Server instance to be used. DeployFields-PWA.PS1 Complete Power shell script file. ProjectServerFields.XML Contains details of custom fields and lookup tables that needs to be created. To run the PowerShell script user must have admin rights and permission to run PSI services. Using DeployFields-PWA.PS1 script, you will be able to create single level lookup tables and custom fields for any entity type (project, task, resource). A log file is also created under the folder where the script file resides which shows the detail of the lookup table and custom fields being created. Let’s discuss the various steps needed for deployment. Load Microsoft.Office.Project.Server.Library in the file by writing below command at the top of the script file[System.Reflection.Assembly]::LoadWithPartialName(“Microsoft.Office.Project.Server.Library”) Load the Deploy -Config.PS1file to read Project Server Instance details in the script. Test-IsAdmin method is used to check user running the script has administrative rights or not. If Yes, then will move further else exit. Creating an assembly from the PSI WSDL service at run time Here, we will be generating the precompiled assembly for the custom field and lookup table PSI services. For this GetPSIServiceAssembly param([string] $webServiceUrl, [string[]] $referenceAssemblies) method is created and parameters being passed are: PSI WSDL URL and the Assemblies references required to compile the WSDL. The assembly references are: “System.dll”, “System.Web.Services.dll”, “System.Xml.dll”, “System.Data.dll”. Creation of Enterprise Project server fields. The WSDL assembly created in above step will be used to create the project server enterprise fields. A single PowerShell method LookupTable_CustomFieldsCreation is created in which we will first create the lookup tables and then the custom fields.The lookup table PSI service url is:+ “/_vti_bin/psi/LookupTable.asmx?wsdl”The custom fields PSI service url is:+ “/_vti_bin/psi/CustomFields.asmx?wsdl” Creating lookup tables Read each entry of lookup tables from ProjectServerFields.xml file. If lookup table with same name exist in project server, then continue with the next. If the lookup table doesn’t exist, then create a new lookup table row. Creating custom fields Get the entity id of the various entity type i.e. project, task and resource Get the list of existing custom fields associated with each of the entity type. Get the Lookup table id if custom field is associated to lookup table. If custom field do not exist create a new custom field row. To run the script, give the path of DeployFields-PWA.PS1 file on Windows Power Shell Console. This is how lookup tables and custom fields are created using power shell scripting. In my next blog I will be explaining how the Graphical Indicators are created using the power shell script. You can get the complete PowerShell script package from here.
Enable Your Data with Adaptive BI for Excellence

Right use of enormous data available internally and externally to organizations can generate immense dividends. Deriving meaningful insights from that data—and converting knowledge into action—is easier said than done. Organizations have been utilizing Business Intelligence (BI) and analytics to analyze and visualize complex data sets, but the biggest challenge is finding the set of right solutions that enable organizations to generate value through the process efficiently. As the data management challenges grow, the use of BI within the organization has extended and triggered the need for self-service BI – to enable everyone to gain visibility into business operations and to make data-driven decisions efficiently, today and for the years to come. So, what’s next? Companies need a right mix of people, processes, and technology to enable and govern their data and unleash the real value of it. Advaiya’s Adaptive BI services fulfil an organization’s need for data aggregation & visualization across its functions. With our extensive knowledge and expertise, association with state-of-the-art technologies like Microsoft and TimeXtender, we deliver a BI solution that meets business analytics needs at all stages of the BI lifecycle. We deliver intelligent insights with user-centric information design to help you become more mature and capable data-driven organization. We use an intelligent and structured approach to bring your data to next-level and help get all the valuable data and comprehensive insights at your fingertips. We make advanced technologies, like Power BI and automation to enable data discovery, availability and comprehension, so you can use your data effectively, today and in future. Just an example, how an appropriate information design with comprehensive data from multiple sources provided significantly useful insights for disease control and prevention via rich visualization. Get easy access to data from multiple sources, gain insights via interactive dashboards & reports, be informed and make better decisions. Get started today with D.I.A.D (Dashboard-in-a-day), our Data Enablement services to help you understand your data better through meaningful visualization.
Handling Managed Metadata Using SharePoint List Workflow
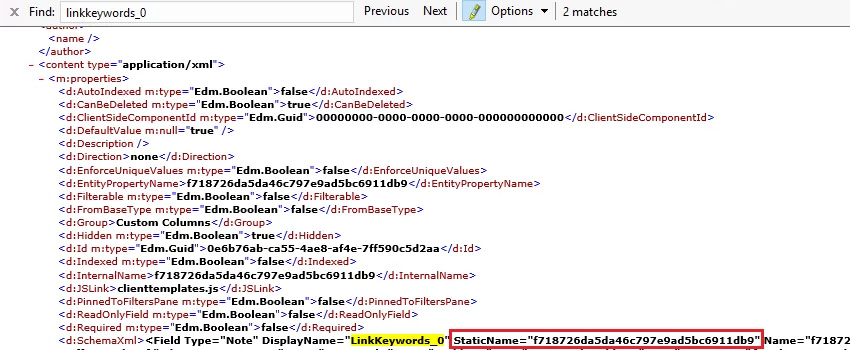
Recently we did a couple of Project Server/Online Implementation based projects which included customizations like Demand Management Workflow, Document Approval workflow, Issue or Risk Escalation workflow and much more. This required Project workspace customization to enable standard processes for every project within client EPM tenant setup. During these customizations, one challenge was to apply an item approval workflow for a custom list of the workspace, and when the list item is approved, the list item should be copied/moved to another list which has all approved list items only. We thought this should be an easy solution using SharePoint designer workflow and should not take much time to implement 🙂 but twist came when we found that a list item can be copied easily by using Create new list item/Update List item workflow activity but any managed metadata column does not follow this. Below is the detailed error and solution, how we customized the managed metadata updates on a SharePoint list using SharePoint Designer. Scenario: In SharePoint Designer you can use the “Update List Item” action to update a field in list or document library. But, whenever you update a managed metadata field through the “Update List Item” action, or you create an item from one to another list containing managed metadata field through the “Create item” action, a BadRequest error occurs: Follow below-given steps for the solution to your problem: Let’s, create two SharePoint lists, Pending Links & Approved Links. New link item is added to Pending Links; then it is routed to Link Managers for approval. If link item is approved then it is copied to Approved Links, else remains in Pending Links. Add managed metadata field, for, e.g., LinkKeywords, to both lists. Both Pending Links and Approved links contains these 3 fields : Note: Managed metadata field name should not contain a blank space. Otherwise managed metadata field value would not be updated using workflow. SharePoint will automatically add another field called “LinkKeywords _0”. Steps 1. Get the internal name of LinkKeywords_0: Go to https://xyz.sharepoint.com/site/_api/web/lists/getbytitle(‘listtitle’)/fields Static name for LinkKeywords_0 hidden field is “f718726da5da46c797e9ad5bc6911db9”. 2. Get the list item type entity type full name: Go to https://xyz.sharepoint.com/site/_api/web/lists/getbytitle(‘listtitle’) ListItemEntityTypeFullName of Approved Links is “SP.Data. Standard format for ListItemEntityTypeFullName is “SP.Data.<>ListItem”. Space in list title will be replaced by “_x0020_”. 3. Add workflow action to create item: Use workflow action “Create list item”. Item will be created from Pending Links to Approved Links, whenever task outcome is approved. Add fields other than managed metadata field. The outcome of this process will be taken into NewItem variable of GUID type. Here, do not add managed metadata type field otherwise you will get error “An unexpected ‘PrimitiveValue’ node was found when reading from the JSON reader. A ‘StartObject’ node was expected”. Now, workflow has been configured to create item in Approved links, but managed metadata field has not been updated on list item. To do this you need to use workflow action “Call HTTP Web Service” followed by building required dictionaries. 4. Build Headers dictionary to store following headers: Use workflow action “Build Dictionary”. 5. Build metadata dictionary for List item type: Use workflow action “Build Dictionary”. 6. Build the data dictionary: Use workflow action “Build Dictionary”. 7. Call HTTP Web Service: Use workflow action “Call HTTP Web Service”. Add Service URL of item to be updated: ID can be retrieved as: Where NewItem is GUID of item added to Approved Links, on which you want to update managed metadata field value. Change HTTP method to HTTP POST: Set HTTP Web Service Properties as: 8. Publish workflow. Final workflow appears as: 9. Add new item to Pending Links as: 10. When a new item is created, it’s approval status will set to Pending Approval as: A task approval will be processed for Link Managers. 11. If link item is approved then Approval Status will set to Approved: 12. New item will be added to Approved Links as: So, now using these steps you can updated managed metadata field. Hope, it was helpful to you.
Use Power BI mobile app to view reports and dashboards

Power BI makes your data travel along with you and stays connected to your data from anywhere, anytime with the Power BI app for Windows, iOS, and Android. Power BI Apps for Mobile Devices Power BI mobile app lets you connect to your data anywhere and anytime once you’ve created Power BI reports in Power BI Desktop, and Power BI dashboards in the Power BI service and published to http://powerbi.com/. The Power BI mobile apps are available for the following devices: Sign Up For The Power BI Service On The Web • First, you have to sign up for Power BI service, go to http://powerbi.com/ for creating and storing dashboards and reports, and to bring your data together. • Then to see your dashboards sign in to Power BI from your Android phone. • In the Power BI service, tap Sign up to create a Power BI account. • Start creating your dashboards and reports. Viewing a Dashboard Tap the dashboard to open it. • Yellow stars show the dashboards which are put in favorites. Power BI dashboards look a little different on your phone. All the tiles are of the same width, and they’re arranged one after another from top to bottom. To view them in landscape mode you can turn your phone sideways. 1. On the dashboard, tap the vertical ellipsis (…) next to the name to invite a colleague, refresh, and to get more information about the dashboard: 2. Swipe up and down to see all the tiles in the dashboard. Viewing Your Favorite Dashboards, KPIs, and Reports On the favorite page, you can see all your favorite Power BI dashboards, together with Reporting Services KPIs and mobile reports. • Tap Favorites • All your Power BI favorites and your favorites from the reporting services web portal can be seen on this page. Viewing a Report When you create reports in Power BI Desktop, you can create an optimized version for phones too. • Open a Power BI report: • Tap reports on the main page of the Power BI mobile app, then tap the report you want to open. • All the Power BI reports, and Excel workbooks that you have in the Power BI service can be seen here. • On a dashboard, tap the ellipsis (…) on a tile then Open Report. • To view other pages in a power BI report: ? Swipe from one side or the other, or tap the page name from the Pages icon in the lower-right corner. To Sort a Chart • Tap your chart, tap the ellipsis (…) and tap the field name. Sort order can be reversed too by tapping the Sort by arrow, then tapping the same field name again. To Filter a Power BI Report • First, expand the filters pane. • If you have set page-level filters in your report, then after selecting a visual you will see visual-level filters for that visual and for the whole page, page level filters will be seen. • Select check boxes for any values you want. • You can also switch the filtering mode by tapping Basic filtering or Advanced filtering to select values using expressions instead. • Expressions such as are less than, is greater than, is not, and is blank is offered by number fields. • Expressions such as contains don’t start with, and is not is offered by Text fields. New Added Features in Power BI Mobile Apps Meet your specific information needs and take better decisions with solutions for visualization and aggregation of data from across your business with our Adaptive BI solutions. To understand more about data visualization and reporting, and how can you use Power BI to make sense of your business data, visit our Adaptive BI solutions.
4 Key Factors for Intranet Platforms | Advaiya

The first “intranet” was Yammer, which was just a place to share social updates with co-workers. Today organizations need an advanced platform they could customize that would allow them to share and organize files, too. Enterprises today battle with four common complaints with a traditional intranet: “I don’t know where to post.” “I don’t know how to post.” “I can’t find what I need.” “I can’t access what I need.” Also, it became apparent that a platform designed for desktop users who work in an office setting simply would not work for a mobile workforce. Organizations today employ associates across the globe, most of whom go online via their smartphones. We cannot expect our associates to wait until they could get to a computer to read important company news or file in their expenses. Simply put, the traditional platform is failing to give them the information they needed when and where they needed it. For a workplace intranet to be embraced quickly by your associates, a few key factors that enterprises should keep in mind when assessing intranet platforms: Leverage current investments. Choose a solution that can leverage your existing IT investments and can facilitate seamless integration with your current business enterprise. Customizability and ability to extend/alter easily. Your modern intranet set up should be adaptable to be tailored, modified and reconfigured to suit your organizational needs. Should not require dedicated content managers. It should be backed up with meta data driven technology to fetch information and surface it in an intuitive and contextual manner. Provide localization and personalization. Don’t underestimate the cost and time associated with searching for relevant information & news by the workforce. The platform you select should quickly display information & news based on location, job role, time of the day without having to search for it. We are excited about the change modern intranet can bring to your workplace and this brought us to creating AdVanced – Modern Intranet for O365. AdVanced allows you to quickly build a modern intranet for your organization. It brings together a contemporary and personalized “Home page @ work” for your team, allowing easy access to relevant information, documents, applications and people. Powerful configuration options enable the solution to fit your unique contexts. AdVanced comes with a bundle of widgets facilitating conversations, discovery and awareness powering all information activities that your team performs. The benefits: 1. Drive Employee Engagement a. Employee recognition, Feedback and participation, Corporate communications, Interest based content, modern workspace 2. Connect, coordinate and innovate a. Connect to right people, organize events and initiatives, ease processes for support, PTO, expense submission and more 3. Surface Right and Relevant Information a. Personalized content, Easy access to document libraries, Add dashboards and data widgets To experience AdVanced on a live instance. Register here www.advaiya.com/advanced
Sitecore Experience Marketing Demystified

Sitecore is an enterprise-class content management system (CMS), and its Experience Marketing System (formerly known as DMS) module can advance your digital marketing practices and enhance conversions from your website. This Digital Marketing System helps bring quality leads through email, mobile, web and social channels right at your fingertips and makes information of campaign and site performance easy. Sitecore Experience Marketing System is a robust marketing solution that allows a one-stop shop for marketing data and insights for an enterprise Sitecore Experience Analytics reports help you to categorize patterns and trends in customer interaction data, collected from websites and other data sources in the following ways: Dashboard – provides an outline of key analytics and performance indicators Acquisition – identifies what is driving traffic to your website, e.g., which campaign worked well and which didn’t, channel sources, target keywords, or referring site Audience – gives you knowledge of who your visitors are, from where they landed on your website, and showcase the efficiency of your buyer persona strategies Behavior – helps you evaluate your visitors’ actions. What pages have they visited and what have they downloaded on that page? Conversion – gives you knowledge of what is most effective in driving customer’s attention for your product or service Sitecore Email Experience Manager, smoothly integrates with your web platform, helps you execute targeted campaign, track performance metrics, perform marketing automation and personalize the content. Some of the exciting features are: It lets you customize your customer information and send email dynamically across customer segments It also provides information about the entire customer journey, starting with email open rate and click-through to website actions and engagement, goals and conversions Allows you to define an end to end campaign workflows by identifying the right actions and scheduling it to trigger at the right time Allows you to test every single component of a campaign to establish and improve customer engagement Another element which makes it a hot cake is its seamless social integration by making social conversations part of the connected customer experience. There are a variety of powerful solutions to help you make the most out of your corporate social media, starting from allowing social communities on your website to connecting social data to drive most relevant and exceptional customer experiences across channels. Sitecore Experience Marketing System has the power to take your web presence to the next level. Its advanced analytics can be very helpful to identify the visitors and thus converting them into leads. It can deliver everything from basic analytics to sophisticated email campaign management with the highest level of customizations. In this way, marketers can achieve content, analytics, testing, email, personalization, and automation in the same interface and can track all the data at a single location, thus avoiding the need for various platforms and unnecessary administrative work for your marketing team.
Automation of Project Plan Backup

It’s often required that project manager /administrator in project server wants to track the changes done in the project plan or take the backup of a project plan for further reference. There can be a manual way to perform this action by Opening each project and saving the project plan from the project professional. In this blog, we are going to automate the process by creating a macro in VBA that will allow the administrator to take the backups of all the project without manually opening each project. A STEP BY STEP GUIDE TO GET THIS DONE IN MINUTES Get the List of Project in Excel using Odata Create a list of the projects for which you would like to export the MPP file. We will get the list of projects using Odata from project server in an Excel file and now follow these commands: • Create a new Excel file. • Go to Data Tab and in Get External Data Section, Select ‘From Odata Data Feed’ as shown below • In the pop up window, enter the Odata Url of get the project server /_api/ProjectData/Projects()?$Select=ProjectName • Click on Next • Another Pop window will appear, Enter the User Name and Password • Pop window will come to Select Projects Table • Click on Next, enter the name of data connection file. • Click on Finish. • Another POP window will come for Import Data as shown below, click on OK button • Now List of Projects from Project Server will be displayed as shown below. • To get the refresh list of project, go to Data Tab, Click on Refresh All. This will update the project list from project server. Take the Backup of the Project Plan • Open Microsoft Project File “Backup Project Plan. Mpp” and Login with the PWA account for which backup is required. • Copy the Project Names from Excel from Step 1 into to a mpp as shown below • If the Developer tab is not visible in Ribbon of Project Professional, go to File -> Options – > Customize Ribbon ? Check the Developer check box and Click OK • Go to Developer tab and click on Visual Studio Visual basic editor will open and there will in the Module1 as shown below and Now Run the module from the ribbon button as highlighted. This will open the project one by one and create the mpp file in the Exports folder set up in C drive as mentioned in above script. Conclusion: Using this approach project administrator can easily task the back of project plan. This mpp files can be used for reference in future.