Establish project and portfolio management in your organization

In recent years, establishing Project Portfolio Management has become a key preference for most of the organizations. There can be seen a huge change in the way organizations are managed and the narrowing of the gap between Project & Program management and top leadership. According to a PM Solution survey, ‘Higher PPM capabilities lead to greater ROI’. The organizations with established PPM processes at the enterprise level are in a better state to make more informed and data-driven decisions on regular basis. No doubt, the glamorous results of PPM practices establishment require time, niche skill set and organization wide adoption and support. Here’s a quick checklist that might come handy when establishing PPM practices in your organization: Get the top leaders involved in identifying the critical needs and issues of the organization, and then design the processes that will best meet those needs. Plan to execute the whole process in phases and decide outcome for each phase, so the effectiveness at each phase can be evaluated. Keep the end users well informed about the PPM establishment and list the changes that can impact the process/way of their work. Select appropriate PPM Methodology that works the best and is easy to adapt to your organization culture. Decide project prioritization with top leaders and PMOs. Ensure that the PPM establishment plan does not include several changes at one time, which may lead to complexity and people tend to ignore them. Decide the channels for process implementation (training/hands-on/ stand up discussion, etc.,) in advance as required at each stage. Document the identified processes. Leverage the best from existing organizational processes and business scenarios, which are relevant to PPM. For example – Elements of processes for planning and cost estimating, project management, risk management, and resource management may need to be refined, expanded, or better coordinated instead of defining them from scratch. These points are an initial homework for the organizations planning for PPM establishment and use. Once this is done, you should select the appropriate PPM software/tool. You may have PMOs in your organization to drive this or you may hire an external consultant to drive the whole process for you. Now, to select the appropriate technology/tool, you must make sure of the following: The solution is scalable to all PPM scenarios regardless of your needs, so you can scale your implementation in future as needed. The solution follows the standards of Project Portfolio Management and at the same time should have the capability to be customized for specific needs as every organization has different standards and processes. You compare the feature and pricing offered by different software/tools. Select an on-cloud solution which is scalable as you use it, and will required less maintenance with minimum infrastructure; unless your organization is a big fan of on-premise solution.
How to create resource availability report on Microsoft Project Online

One of the most important aspects of a resource manager / project manager is to monitor the assignments for each of their resources so that they can effectively balance their team’s workloads. There might be resources that are overallocated or underallocated. The key is to efficiently manage those resources by viewing their workloads and availability in Microsoft Project and making adjustments. MS Project Online combined with MS Power BI is a great online solution for powerful and effective project and resource management. These are some of the views that a resource manager / project manager looks for: Future availability of resources Resource utilization over last week or last month Resource current assignment/ projects Here I will provide you with an overview on how you can connect to Project Online from Power BI and create reports that help in effective project and resource management. To connect to your resource data follow these steps: Open your Power BI Desktop. On the home screen, click on Get Data. Choose OData feed and click on Connect. Then enter the URL for your OData feed in the URL box, and click on OK. Suppose the address for your Project Web App(PWA) site resembles https://.sharepoint.com/sites/pwa, then the address you’ll enter in the URL box for your OData Feed is https://.sharepoint.com/sites/pwa/_api/Projectdata. You will be prompted by Power BI Desktop to authenticate with your Office 365 account. Select your organizational account and then input your credentials. After connecting, choose the tables you would like to connect to and build your query. Choose the appropriate tables from your Project Online for creating Resource Availability Report. For example: take the tables that consist of all the resource data, their roles in your organization, their projects and assignment data, etc. After choosing the required tables, you will need to create the possible relationships between tables. While working on the relationships you need to answer these questions: How much work is allotted to a resource on each day? What are the active tasks a resource needs to work on? What are the future tasks allotted to any particular resource? Which resource is available to work on any project? How much work is assigned to a resource? Which resource is available to work on any project? … and many more. In the Resource Report, you may group the resources by role so when you click on a particular Role, all the resources of that role gets displayed and you may select relevant resources to look into for the details. The below dashboard displays the Resource availability report for next 2 months: You can also drill down into resources. As shown in the below image, if we click on any resource name, we can easily check on what projects is the resource working on. Also, the active, future & overdue tasks for that resource can be identified. This helps in understanding the kind of complexity level task assigned to the resource. Also, the availability of resources for next 2 months can be seen in this report. You can change the duration easily by filtering the date as per the requirement. As shown in the below image, you can see all the available resources for the coming two months and their allocation on various projects. This duration can be changed to look for the information at a certain duration. This report can be a great tool for resource managers to understand the resource allocation and availability at a glance, saving them time invested in navigating to each individual project in Project Online. Similarly, to track the team wise, role wise or department wise resource utilization, all resources can be grouped at a desired level and then their submitted timesheet data can be leveraged to get the utilization. The below report gives the information about resources who are grouped role wise. So, we have seen how these interactive dashboards and reports can be useful to check for the availability and utilization of resources. The above reports are generic and can be created for any Project Online Tenant users and of course can be further customized based on specific needs. To better understand project and resource management, you can watch the recording on Project and Portfolio Management using MS Project Online
Project Server 2007 End of life – Migration options to consider

Office 2007 servers and applications reach the end of its support lifecycle this year, which means there will be no new updates, no assisted support (free or paid), or bug fixes, or any online technical content updates. If you are still on Project Server 2007, this post is for you… read on! Project Server 2007 and related products like Project Portfolio Server 2007, Project 2007 Standard, Project 2007 Professional, will have no more support after October 10, 2017. You should start planning to move to Project Online or upgrade to the supported versions of Project, if you are currently using any of the above products. For more information about this product reaching retirement, see Project Server 2007 End of Life Roadmap. What does End of Life mean for you? You will still be able to install Project Server 2007 after the mentioned date, but because of the above changes, we strongly recommend that you migrate from Project Server 2007 as soon as possible. For your help, here we list a few things that you won’t continue to have it coming from Microsoft: Technical support for problems that may occur with the product at any stage Bug fixes for issues that may impact the stability and usability of the server Security fixes for vulnerabilities that are discovered and that may make the server vulnerable to security breaches Time zone updates What are my options to upgrade/migrate? There might be a lot of head scratching about what to do next if you’re still on legacy versions. You need to weigh your options – should your organization want to stay on-prem or move to the cloud? As a Project Server 2007 user, your migration options can be: Migrate to Project Online Migrate to a newer on-premises version of Project Server (preferably Project Server 2016) Take into consideration how you can cause the least amount of headache for your users. How Advaiya can help you? Upgrading from Project Server 2007 can be challenging, and needs a lot of preparation and planning. It can get even more difficult if you were not the one to setup and configure Project Server 2007 originally. Luckily, you can turn to Advaiya, a trusted Microsoft partner who has been helping customers with complete migration, implementation, adoption, and after support. We can help you to assess tour current infrastructure and requirements, and help you decide your migration to Project Server 2016 or to Project Online. We can make the process quick and easy as we have our own project management tool – AdValue – to get Project Online deployed rapidly and adopted broadly. Call us today!
Unlock the power of workforce data with HR dashboards and reports

We understand that consolidating data from multiple sources, tracking employee engagement, and bridging the gaps within team and management are some of the biggest challenges of an HR executive. With our custom HR dashboards and reports, you can have all your data pulled and presented in one place, visualized through charts, graphs, and other stunning visuals to spot specific trends and measure your company’s progress towards goals. Also, it helps you stay current by scheduling automatic data refresh. Click here to explore the live HR dashboard, and find out how the data filters automatically based on different parameters.
Automate project status reports and stay always updated

Get automated status reports on time and provide comprehensive and correct information.
SharePoint Approval Workflows with metadata made easy
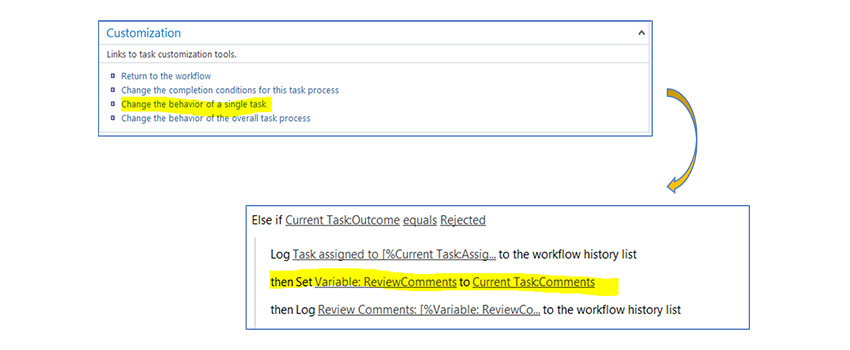
This post talks about the solution to a problem when SharePoint 2013 workflow doesn’t work for document approval workflows.
Simplify project status tracking and save time effortlessly

Quickly share project information that needs your executives’ attention in one view with Quick Insight Executive Dashboard that AdValue offers. The AdValue quick start pack is built on Project Online to bring visibility and clarity to schedules, resources, performance and budgets across portfolio of projects. You have all the needed information for your team through role-based dashboards available to them at all times, so they can gain insights as the project progresses, and make informed decisions. Looking for further info on AdValue – Why not check out this video or read this page for more.
Five easy ways to avoid project delays

Fewer than a third of all projects were successfully completed on time and on the budget over the past year. Keeping projects on track when handling continuous change requests is a project manager’s greatest challenge. From the beginning, if the objectives are not clear, and right expectations are not set with executives, the client, or the team, deadlines can suffer. Project delays are frustrating and costly but can be easily avoided with a little foresight and planning. If we look into the reasons, missed deadlines, unclear objectives, and lack of communication are some of the common causes that can sabotage successful implementation of a project. Here are a few suggestions to avoid unforeseen project delays and efficiently handle large project portfolio programs. 1. Pay a lot of attention to project planning Planning is an essential component of project management and the biggest defense against cost overruns and delays. A well-developed plan in place lowers the overall uncertainty and risks. It would be a good idea to have customized Project Plan templates like Agile Development, or Software Development, specific to organizational standards, and detail out the complete project scope before starting the actual work. Once the scope is defined, get a sign-off from the client and the stakeholders. 2. Keep all information/ assets organized with a single workspace Ensuring that the team members working on the project are organized from start to finish can help in cutting down unnecessary time spent in finding out project related information. Have a central workspace that acts as a portal to store all your documents, track, share and collaborate. Customized project workspace for better tracking, information sharing, and collaboration. 3. Simplify best practices and automate project processes Setup custom process templates to increase standardization, help project teams and set the stage for the upcoming project. This ensures best practices across all projects and saves time and effort which can be invested in other critical project tasks. 4. Constantly track and measure the progress To govern the level of success achieved, the measure of progress attained is necessary. It is imperative to have quick access to all relevant project information and summarized weekly project status for informed decision making. Easy to create BI dashboards for team members, project managers, and executives, can help the entire team stay on track with their goals. 5. Notify stakeholders about overall project status and change requests Giving stakeholders adequate knowledge on the projects health status, team’s achievements and concerns can save the project from trouble in the long-run. The status reports help to raise important matters, discuss them freely and find a solution to issues before they get out of hand. Also, the stakeholders should be notified of any new change requests, the scope of the change, and information about what it will take to implement it. They can decide and take the required action to accommodate the request, without impeding the overall project schedule. Fast track your project schedule with AdValue. Advaiya has designed AdValue pack for project management to help you and your team use standardized processes, and quickly visualize and analyze project data to make better-informed decisions, faster. AdValue is a package you can install on top of your Project Online tenant that instantly helps you to get the most out of your deployment. Here are some of its many benefits: Insightful Power BI dashboards customized for Executives, Project Managers and Team Members Customized project workspace for better project tracking and collaboration Built-in workflow to standardize project management phases Alignment with PMBoK tools to manage projects better Quick and easy deployment to make you look like a superstar Extensible solution that can later be customized to specific needs Need more guidance on project and portfolio management? Write to us to discuss how we can help you and your team become more efficient. Want information about our project portfolio management solutions? Click here
Is your organization truly data-driven?

You are a bank manager. You discover the customer churn rate of your bank which has steadily increased. You realise a loophole in retaining the existing customers of your bank. To validate your instincts, you gather the past six month’s data of customers and hire an analyst to come up with the results quickly. But here is the problem. Analyst working on the project realises that the data has a lot of noise, is not captured at a granular level, is coming from multiple sources, not a single version of the truth and is also limited. Hence insights can’t be drawn at the required time. This results in loss of business. Does this scenario sound familiar to you? The reason behind this grief is the bank is not a data-driven organization. Is your organization data driven? Do you embrace data? Can you provide decision makers of your company with the data they need? Does your organization make business decisions with the help of high quality, noise free, granular data? Are all the data sources integrated at one place providing a single version of the truth? If your answer is yes, then congratulations!! You are indeed a data-driven organization. But if the answer is no, you should infuse analytics in your company. In today’s digital age, we are engulfed with an enormous amount of data. It is an acceptable fact that organizations who have the knowledge to extract insights and decisions based on data would be at a competitive edge rather than the organizations who still have not understood its value. We’re in a digital transformation age where data is more valuable than ever. Companies would only be able to have a competitive edge if they truly understand the power of data and promote the use of data in decision-making. Switching to a data-driven organization usually takes time, but hard work pays off. Constructing this sudden shift is a tedious process but this journey from capturing data to making it trustworthy ensures everybody in the company is on the same page with the most updated information at their fingertips. So how do you turn to a data-driven organization? Below are few points to get started: Information Management: Start capturing the data from the most granular level. Each single field should be detail-oriented. This ensures that every single detail of all the business processes in an organization is identified and stored in databases. Data Integration: Often data does not reside on a single data source. We rely on data warehouses to integrate our disparate data sources. Traditional data warehousing can take up to 6 months to 1 year and significant effort to complete. Surely this is not the right way to stay competitive in today’s ever-changing and ever-evolving data landscape. Is there any solution to optimize the data warehouse lifecycle? This is where automation comes to rescue. We now have self-service data warehouse tools with drag and drop capabilities just like modern BI tools. TimeXtender is a leading data warehouse automation tool which automates the entire cycle of implementing and maintaining a DWH/BI solution. Other notable vendors in this space are Wherescape and Attunity. Next Gen BI Tools: Are you still using traditional BI tools for data integration and reporting? If yes, then you have already lost half the battle. Businesses today can’t wait for weeks or months for the BI reports. And this is where self-service BI tools like Tableau, Power BI, Qlik provide an edge over the traditional IT-centric reporting tools. You can have dashboards/reports in just a few clicks without any involvement of IT. Teamwork and Collaboration: This should be one of the key focus areas to become a data-driven organization truly. Self-service BI tools provide a platform that allows analyst, data scientists, decision makers to work collaboratively and act sensibly on approaches for deriving insights of a company. With the help of collaboration, all the members working on a data intensive project are now able to collaboratively work with real-time access to all the features of a BI tool. Training & Reskilling: Employees should have basic knowledge of reporting skills. Also, the power users of analytics must be reskilled and trained with the latest development in analytics space. This ensures that your organization is well equipped to support value-driven decision making. Welcoming a data-driven approach is vital to your organization. It helps you in making decisions that are informed, intelligent and impactful. To understand more about making powerful decisions that lead to desired results, Register for webinar recording on Make powerful decisions with Power BI